Reliability Model Validation @C3 AI

Role & Duration
Sole Product Designer
4 Weeks
Highlights & Stage
ML / AI Developer Tool
Enterprise Product
Shipped 09/2024
Team Structure
Leadership: Vertical C-Suite Reviews
Peers: 1 PM, 2 DS, 2 SME, 1 Eng Lead.
10+ Engs
C3 AI Reliability Model Validation enables users to assess and verify model performance, ensuring accuracy and reliability before deployment.
Challenge
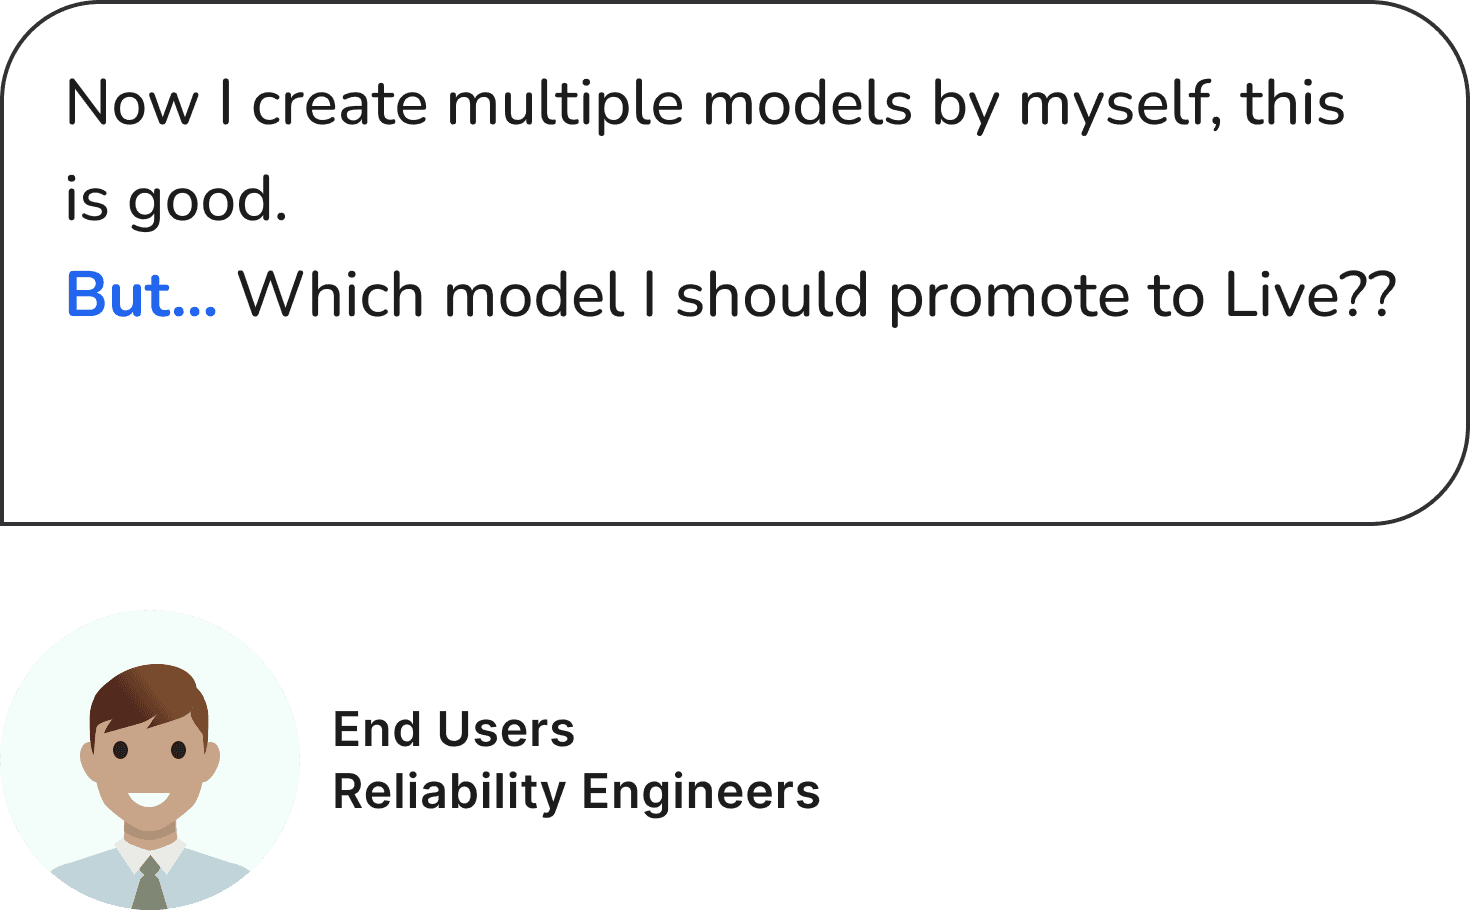
Gap from model creation to deployment
The C3 AI Reliability app uses an Anomaly Detection Model to predict failures and optimize maintenance, reducing downtime.
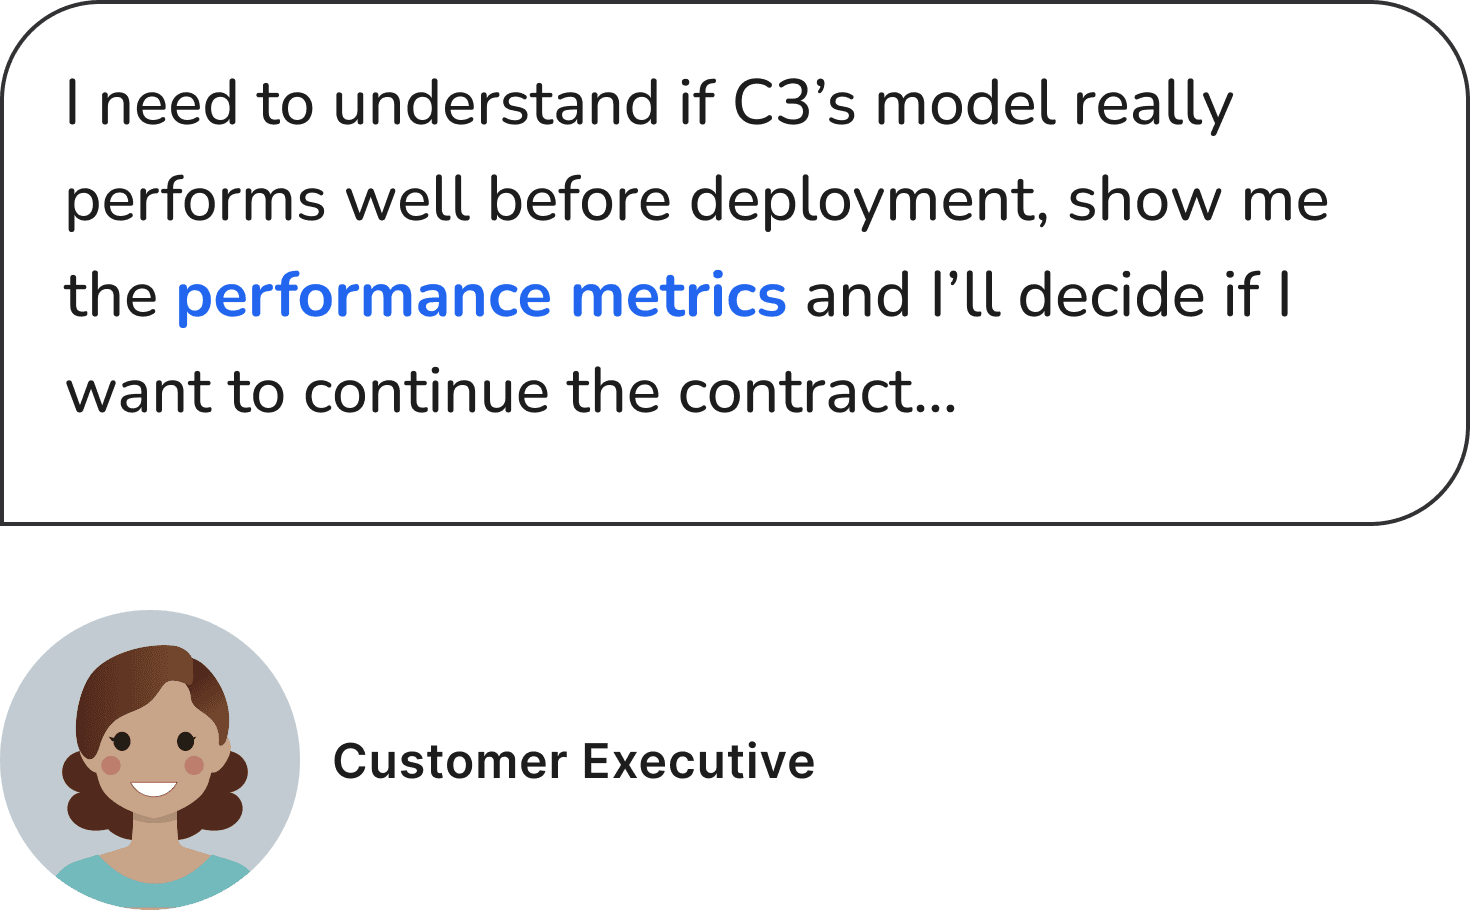
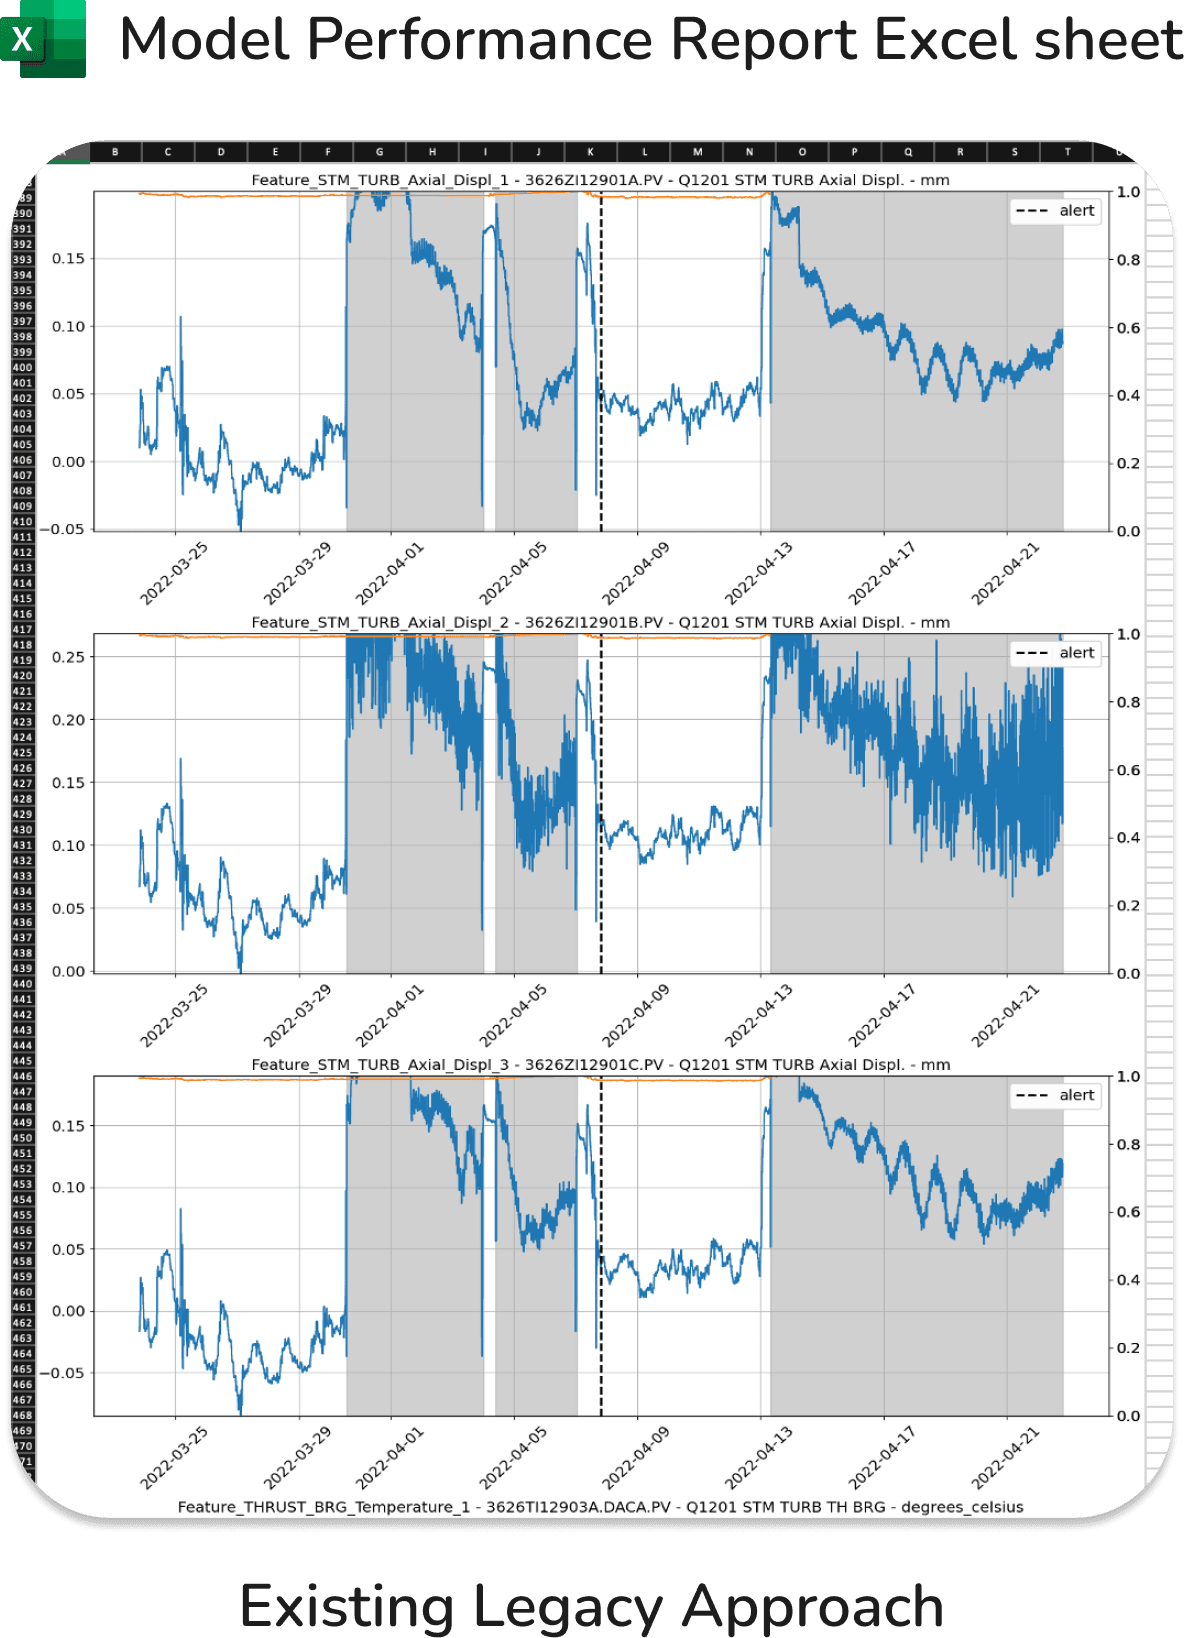
After launching the ML Management module in June 2024, we found a key gap in the workflow: users still print model outputs and manually validate performance before promotion. Executives also request performance data to decide on contract renewals. This highlights the need for a more efficient validation and reporting process.
Initial Assumption
Can we utilize model performance metrics to help users quickly identify the good models?
Given our limited time for in-depth user research and the likelihood of established industry standards in the ML field, I initiated competitor research and quickly identified common practices across similar products.
In analyzing products like Google Vertex AI, Microsoft Azure ML, and Amazon SageMaker, I found that performance metrics such as Precision and Recall are commonly used to help users assess model quality before deployment.
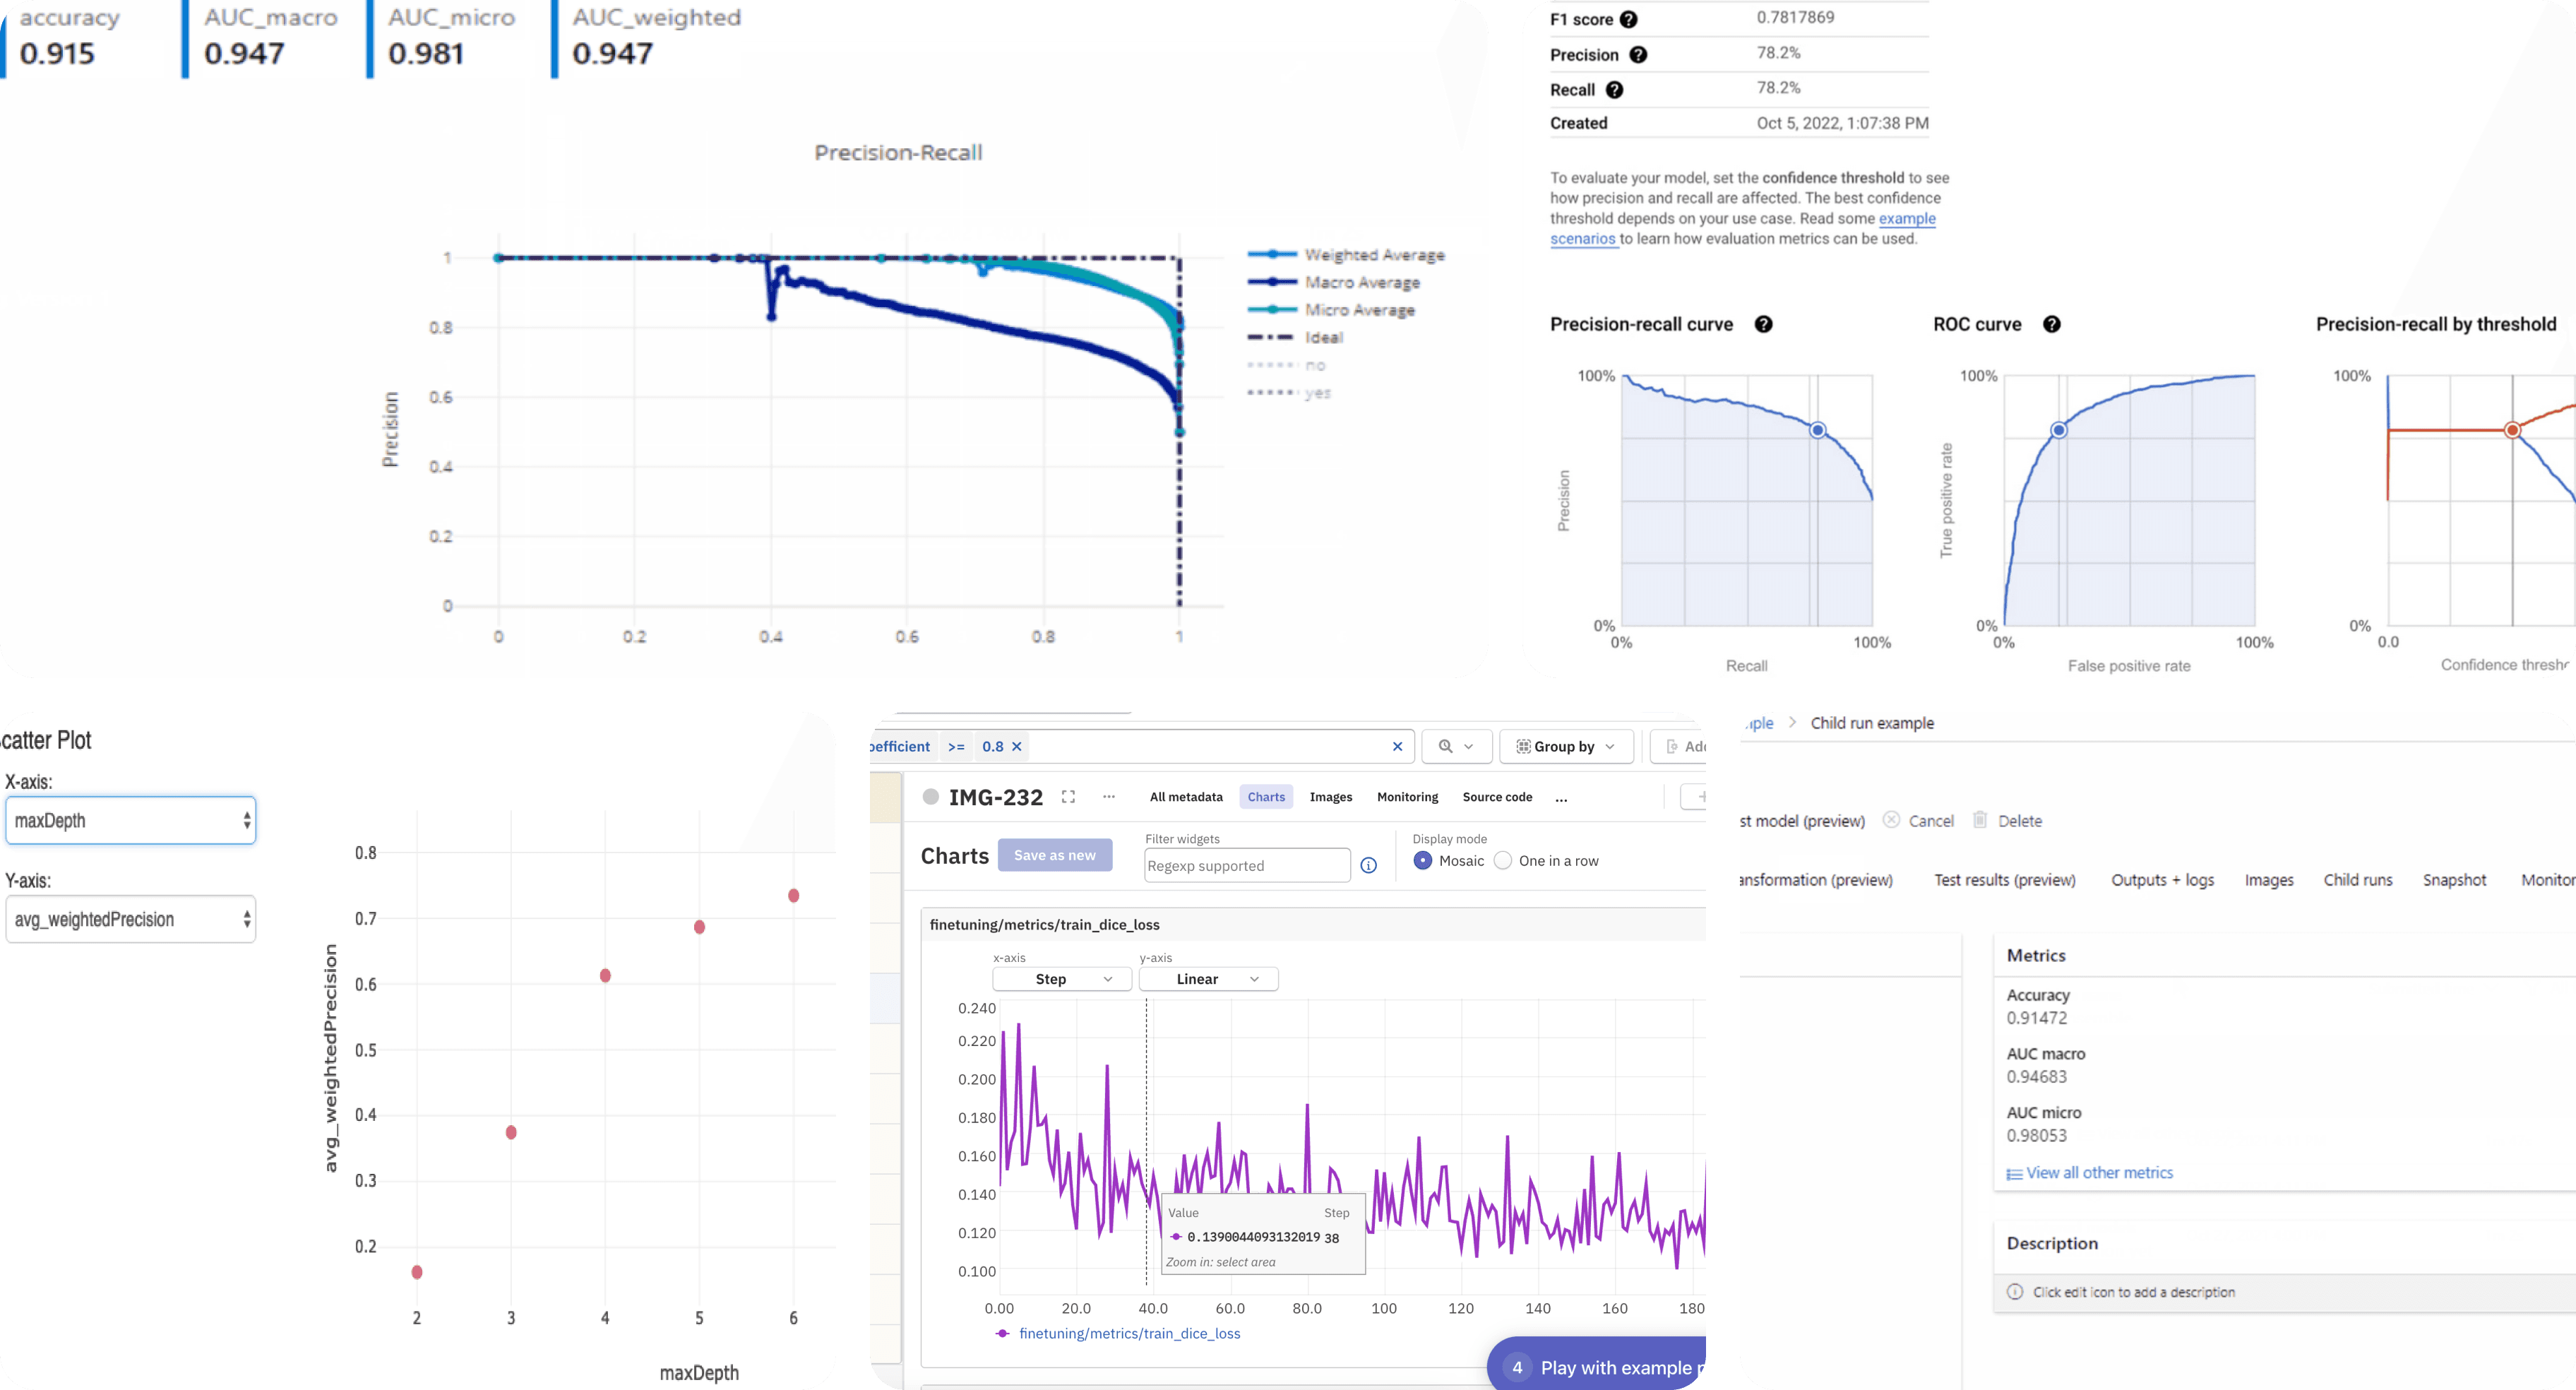
* Model Performance Feature from other products
Understand Different Types of Performance Metrics
With this assumption in mind, I collaborated with Data Scientist to learn more about performance metrics in Reliability.
In reliability modeling, performance metrics fall into two categories. Precision and Recall are key for classification problems, such as identifying anomalies, while MSE, MAE, and MAPE are used in regression tasks like predicting risk scores or temperatures.
Both types are relevant in reliability, but users and businesses often prioritize Precision and Recall. This is because they need to ensure that alerts are triggered before a failure and verify whether a true failure occurs after an alert, making these metrics crucial for decision-making.
Precision, Recall
Business Based Performance Metrics
True positive or false positive of the alert
Measures if the failure really happens
MSE, MAE, MAPE
Model Based Performance Metrics
How far off the risk core prediction are,
baseline performance of a model
However, things are not always optimal...
After I proposed surfacing both types of performance metrics for the model. Data Scientists raised 2 concerns:
We don’t have actual failures data to validate if the alerts are true positive or false positive, so can’t calculate the precision and recall...
- C3 Data Scientist


How might we design an effective and practical model validation experience for Reliability Engineers when there is insufficient failure event data to directly assess model performance?
Process
Model Validation w/o Precision & Recall is Challenging
In order to design the feature that will help Reliability Engineer effectively assess the model performance, understanding what are the key factors when they validate the model is crucial. Consider we have limited time, so I initiated a co-workshop with Data scientists and users to identify the biggest opportunities. From the workshop, we agreed on the following design opportunities:
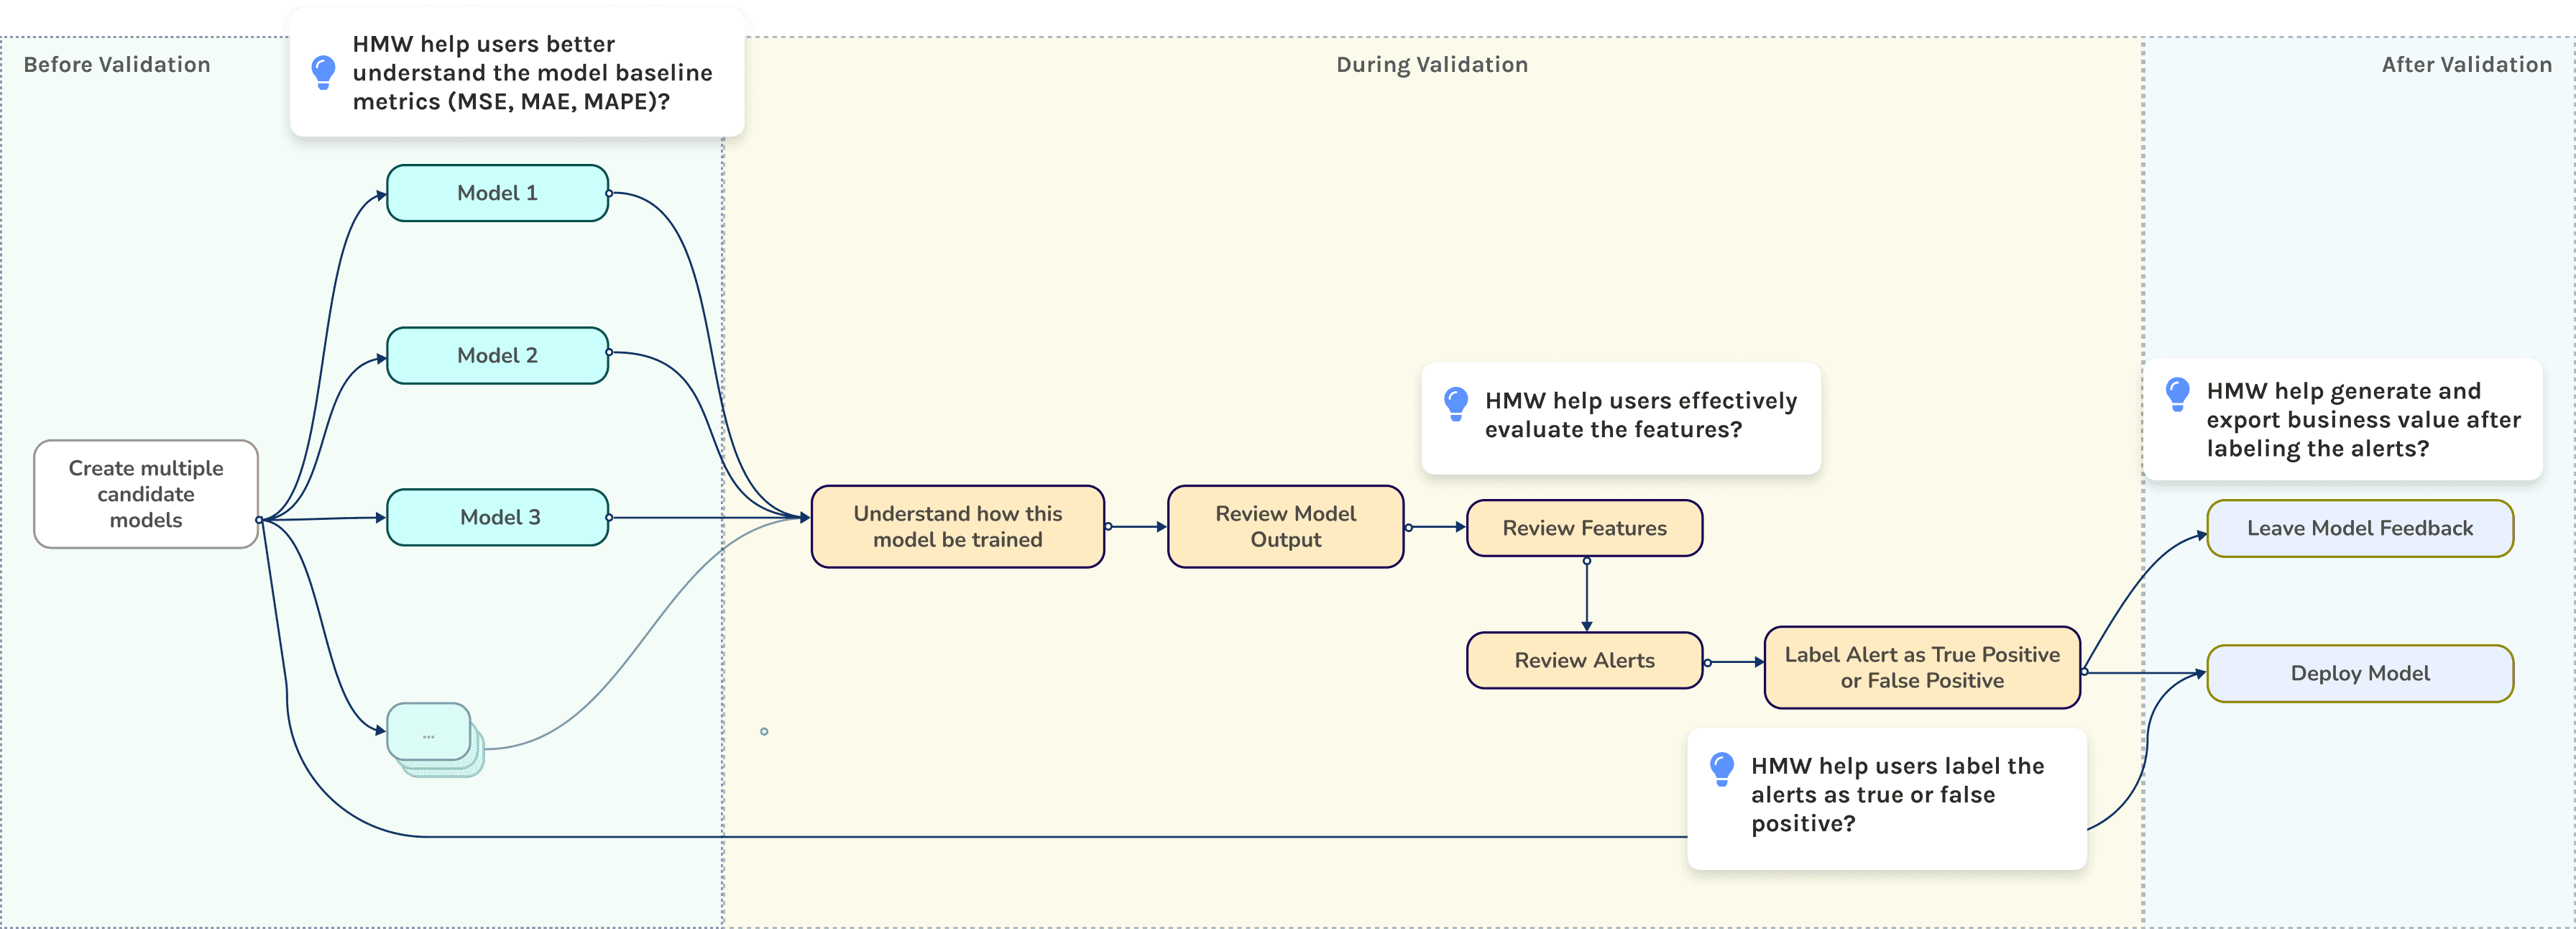
Design Decision 1
HMW help users better understand the model baseline metrics?
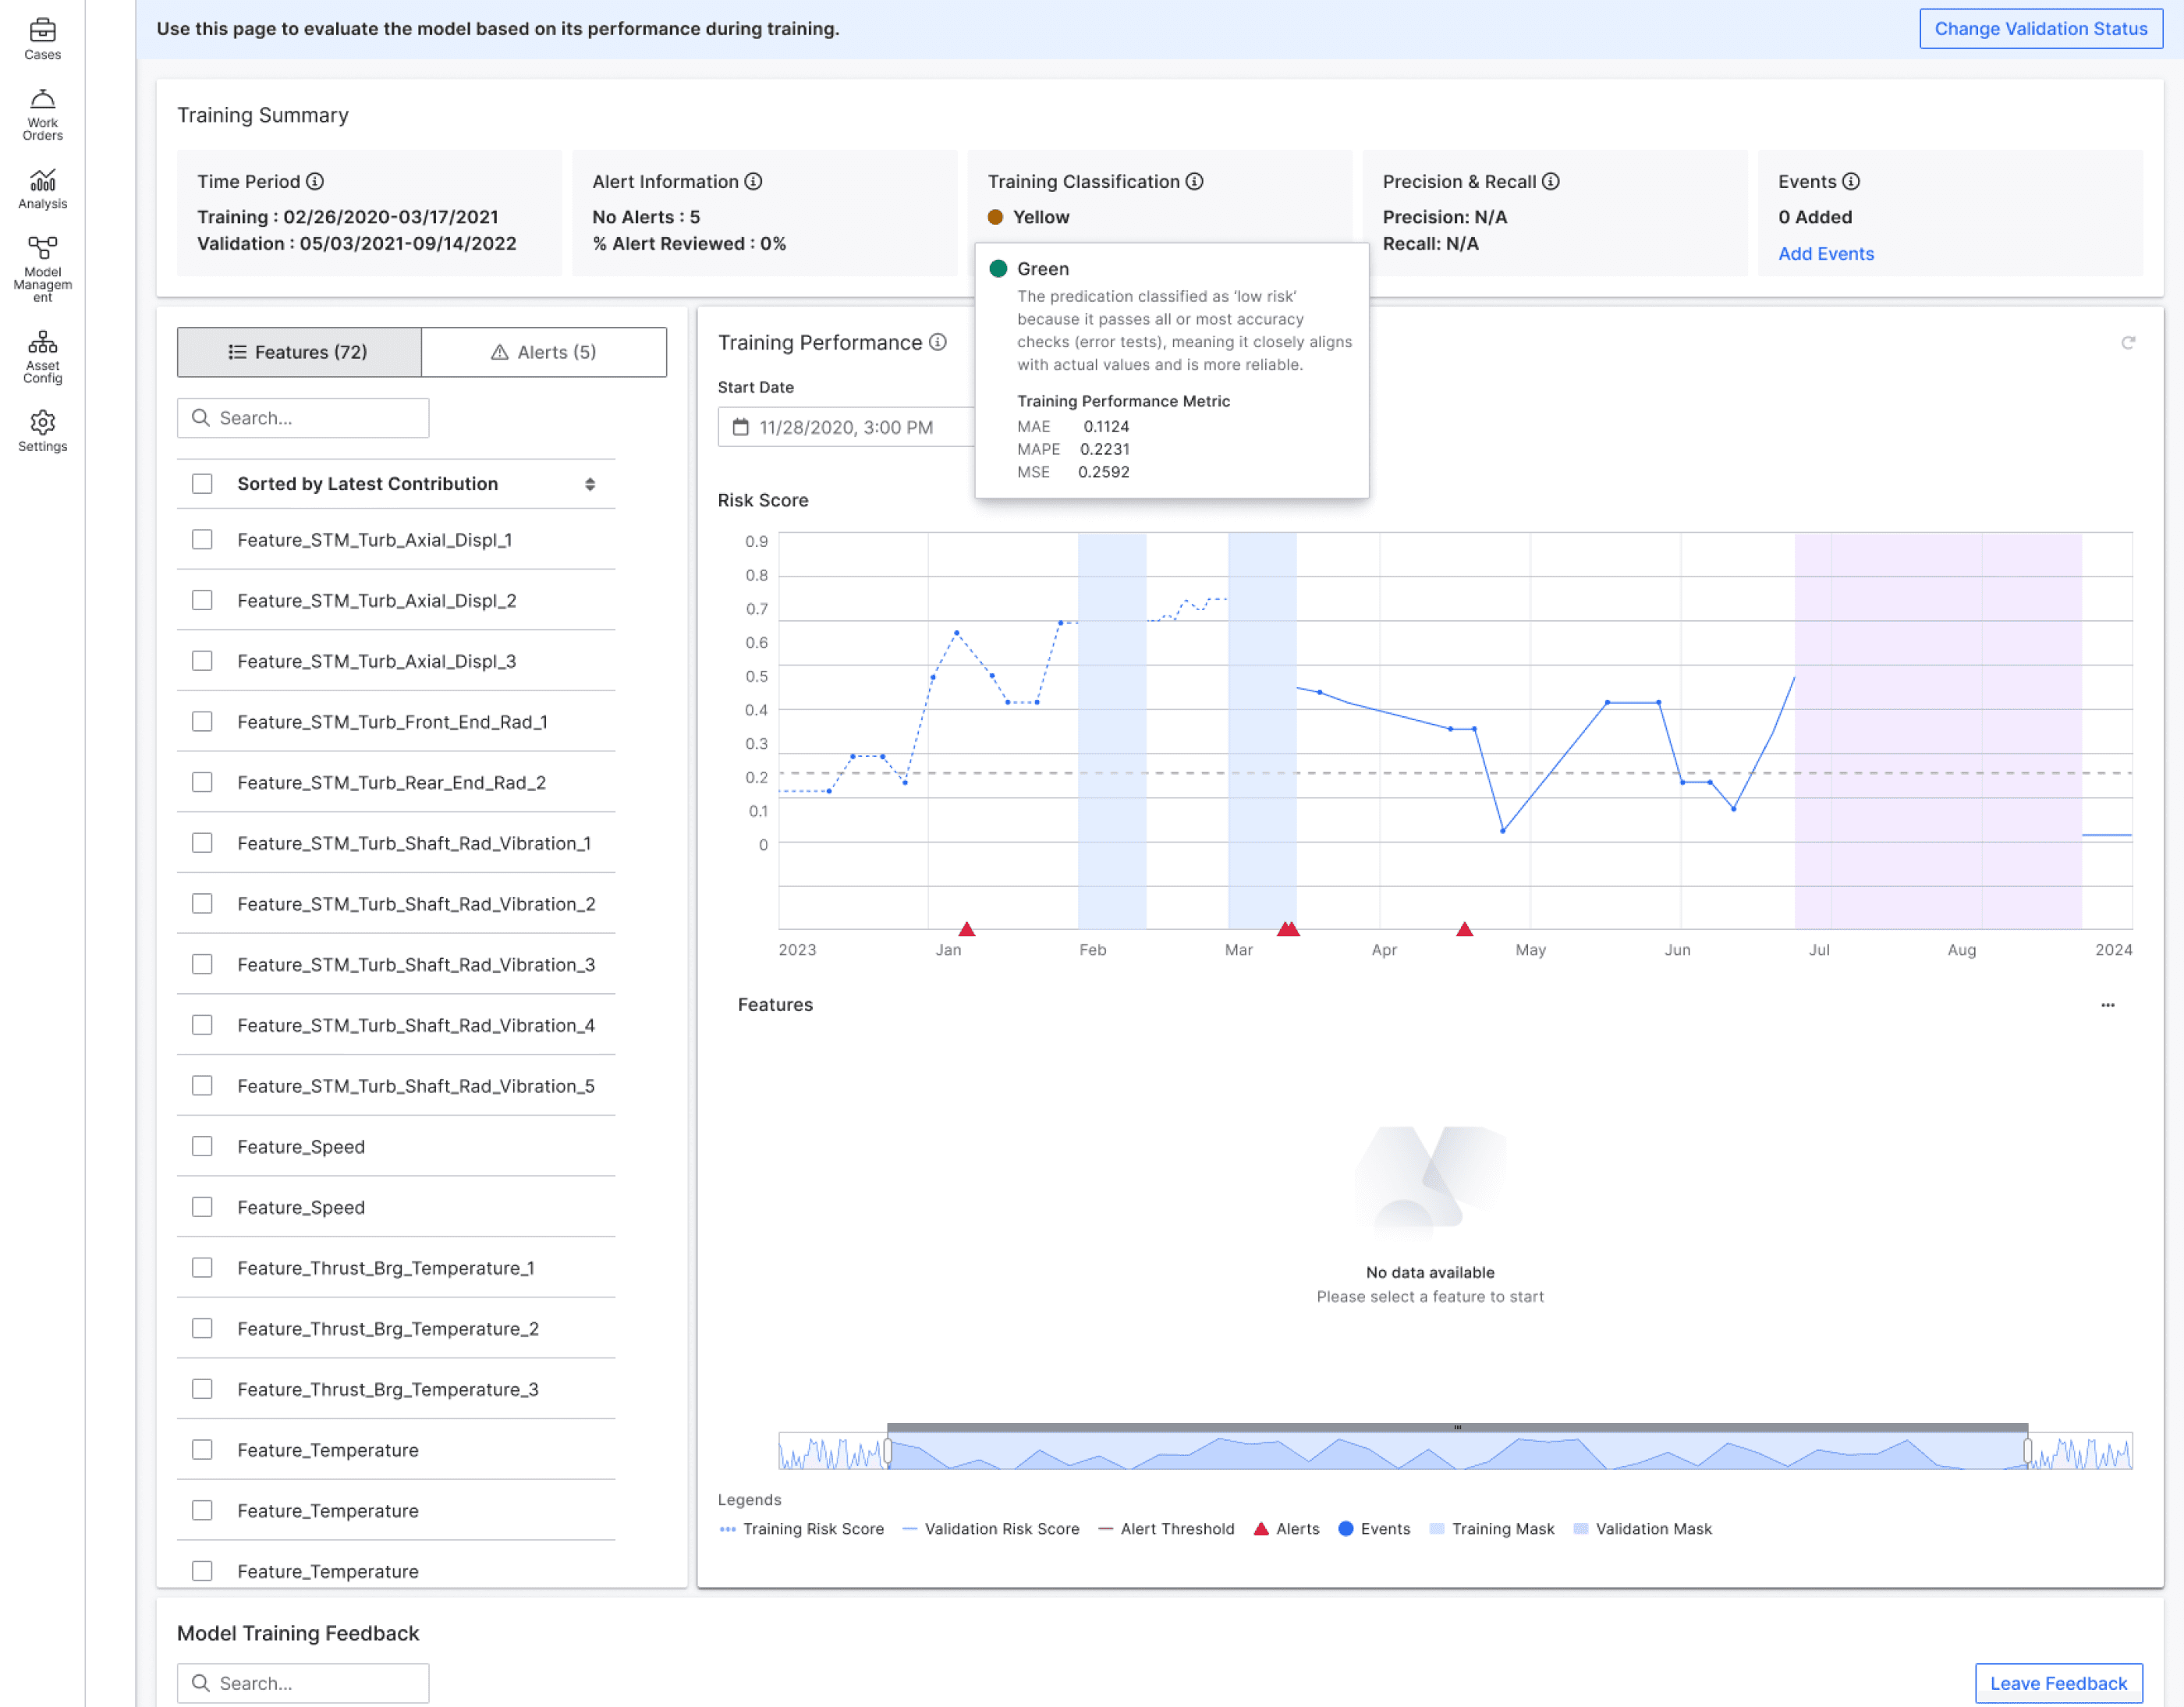
Before validation, users rely on MSE, MAE, and MAPE to compare models. To simplify interpretation, we introduced an aggregate score and used progressive disclosure to explain its calculation, making model selection easier.
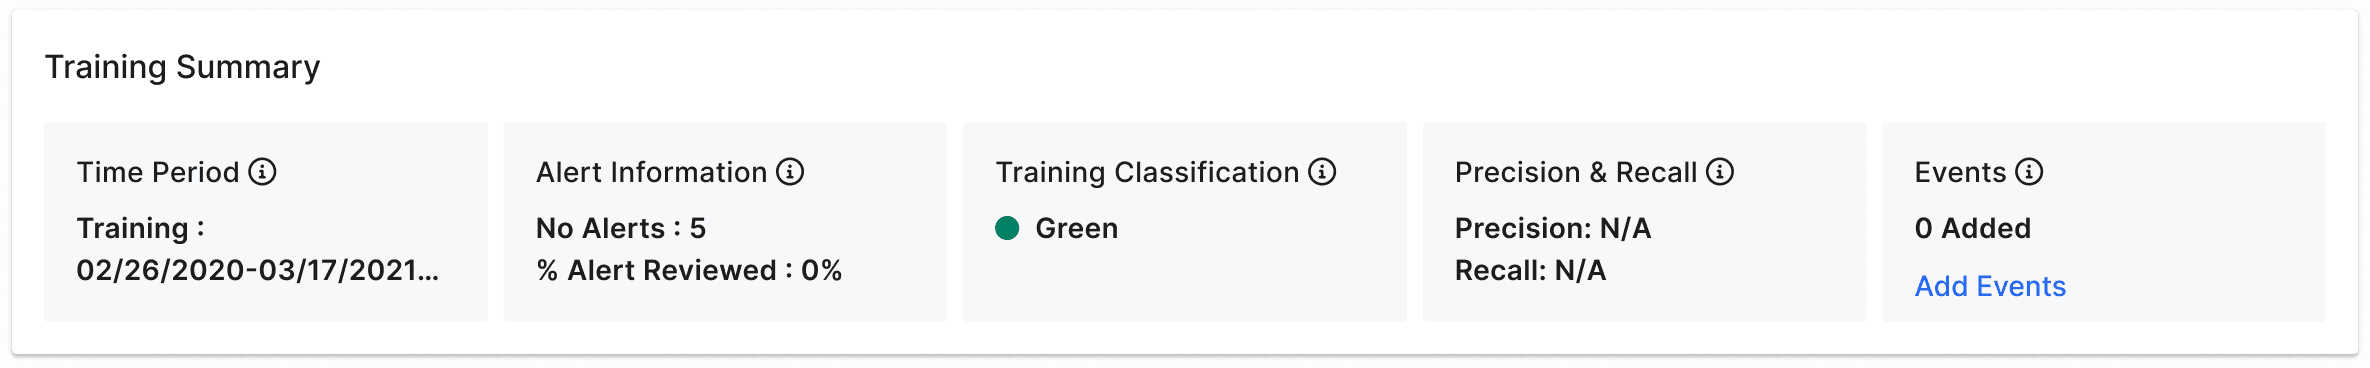
circle
Green
circle
The predication classified as ‘low risk’ because it passes all or most accuracy checks (error tests), meaning it closely aligns with actual values and is more reliable.
circle
Training Performance Metric
MAE
0.1124
MAPE
0.2231
MSE
0.2592
Create an easy-to-understand aggregate training classification, serve as model baseline
Provide classification explainability
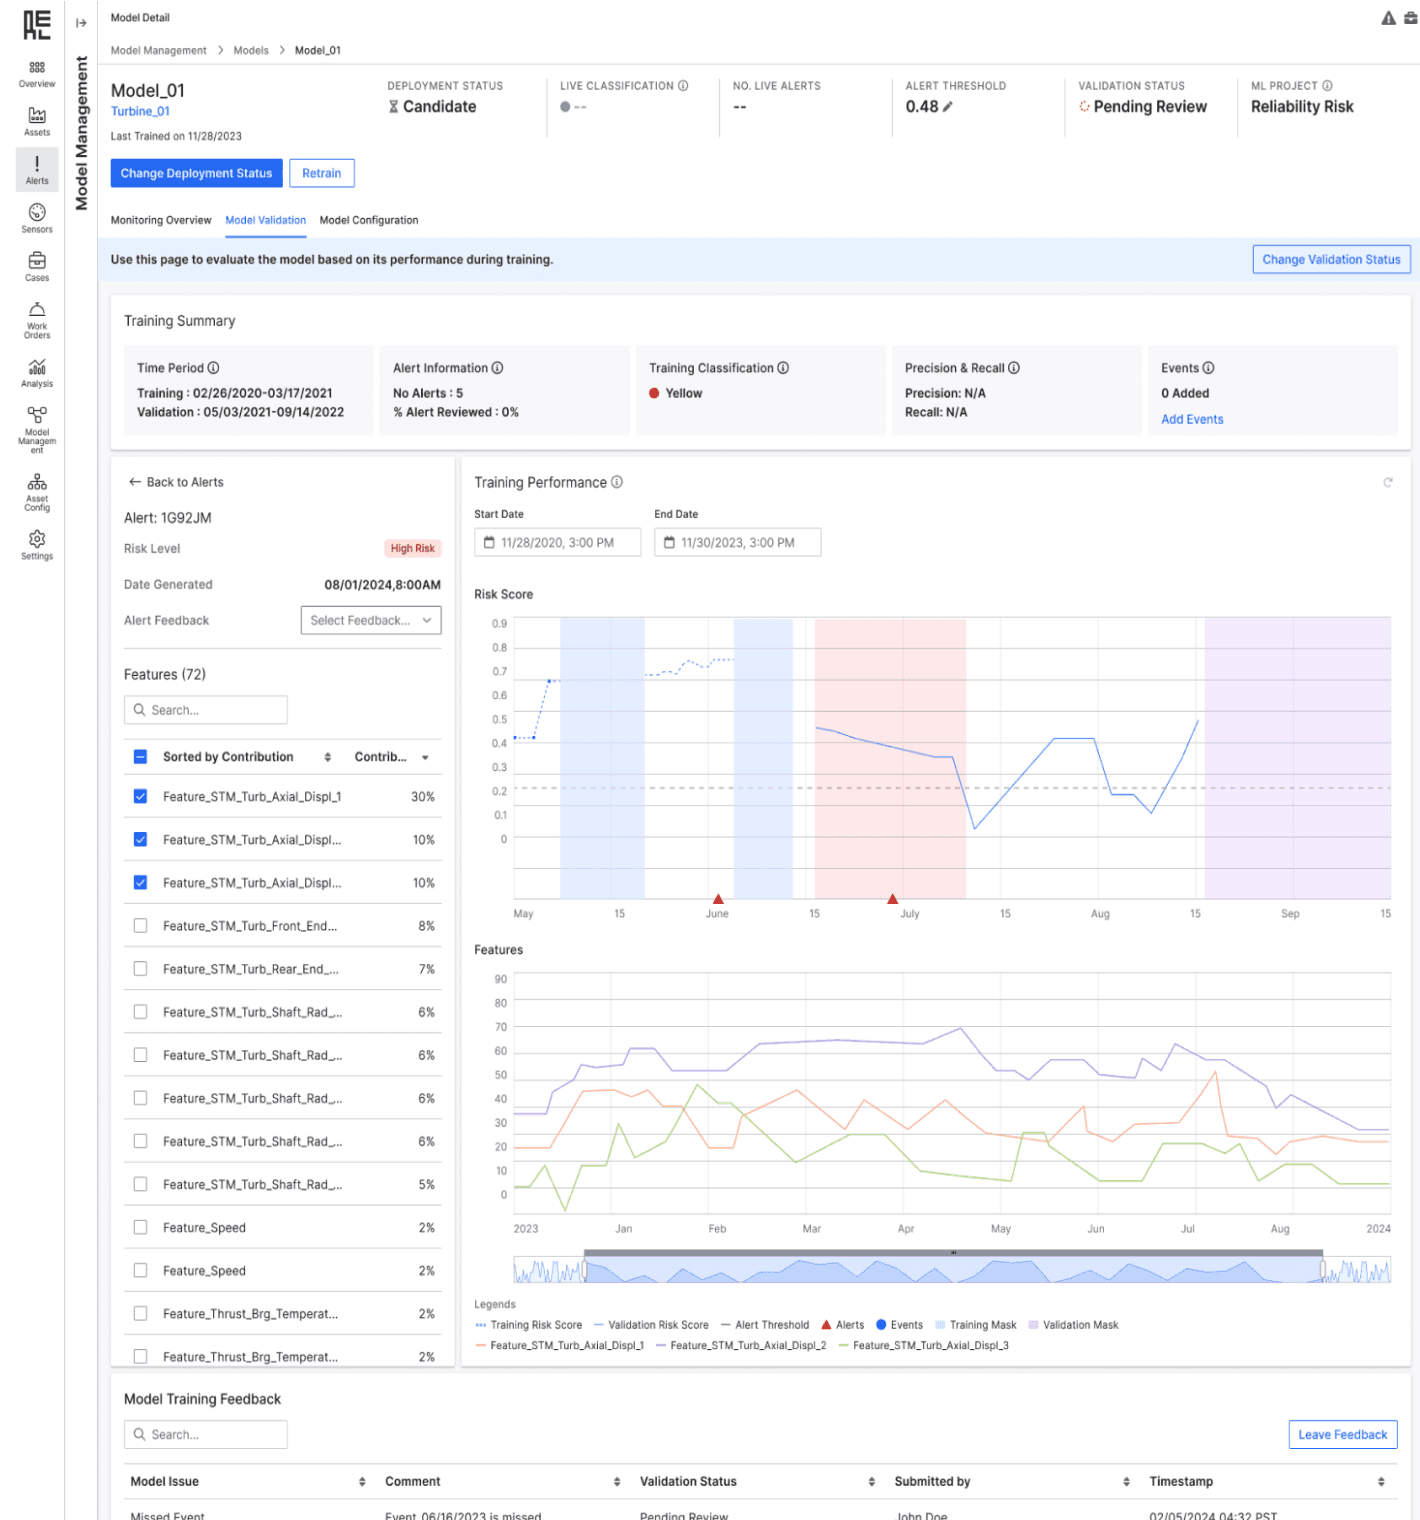
Design Decision 2
HMW help users effectively evaluate the model features & label the alerts?
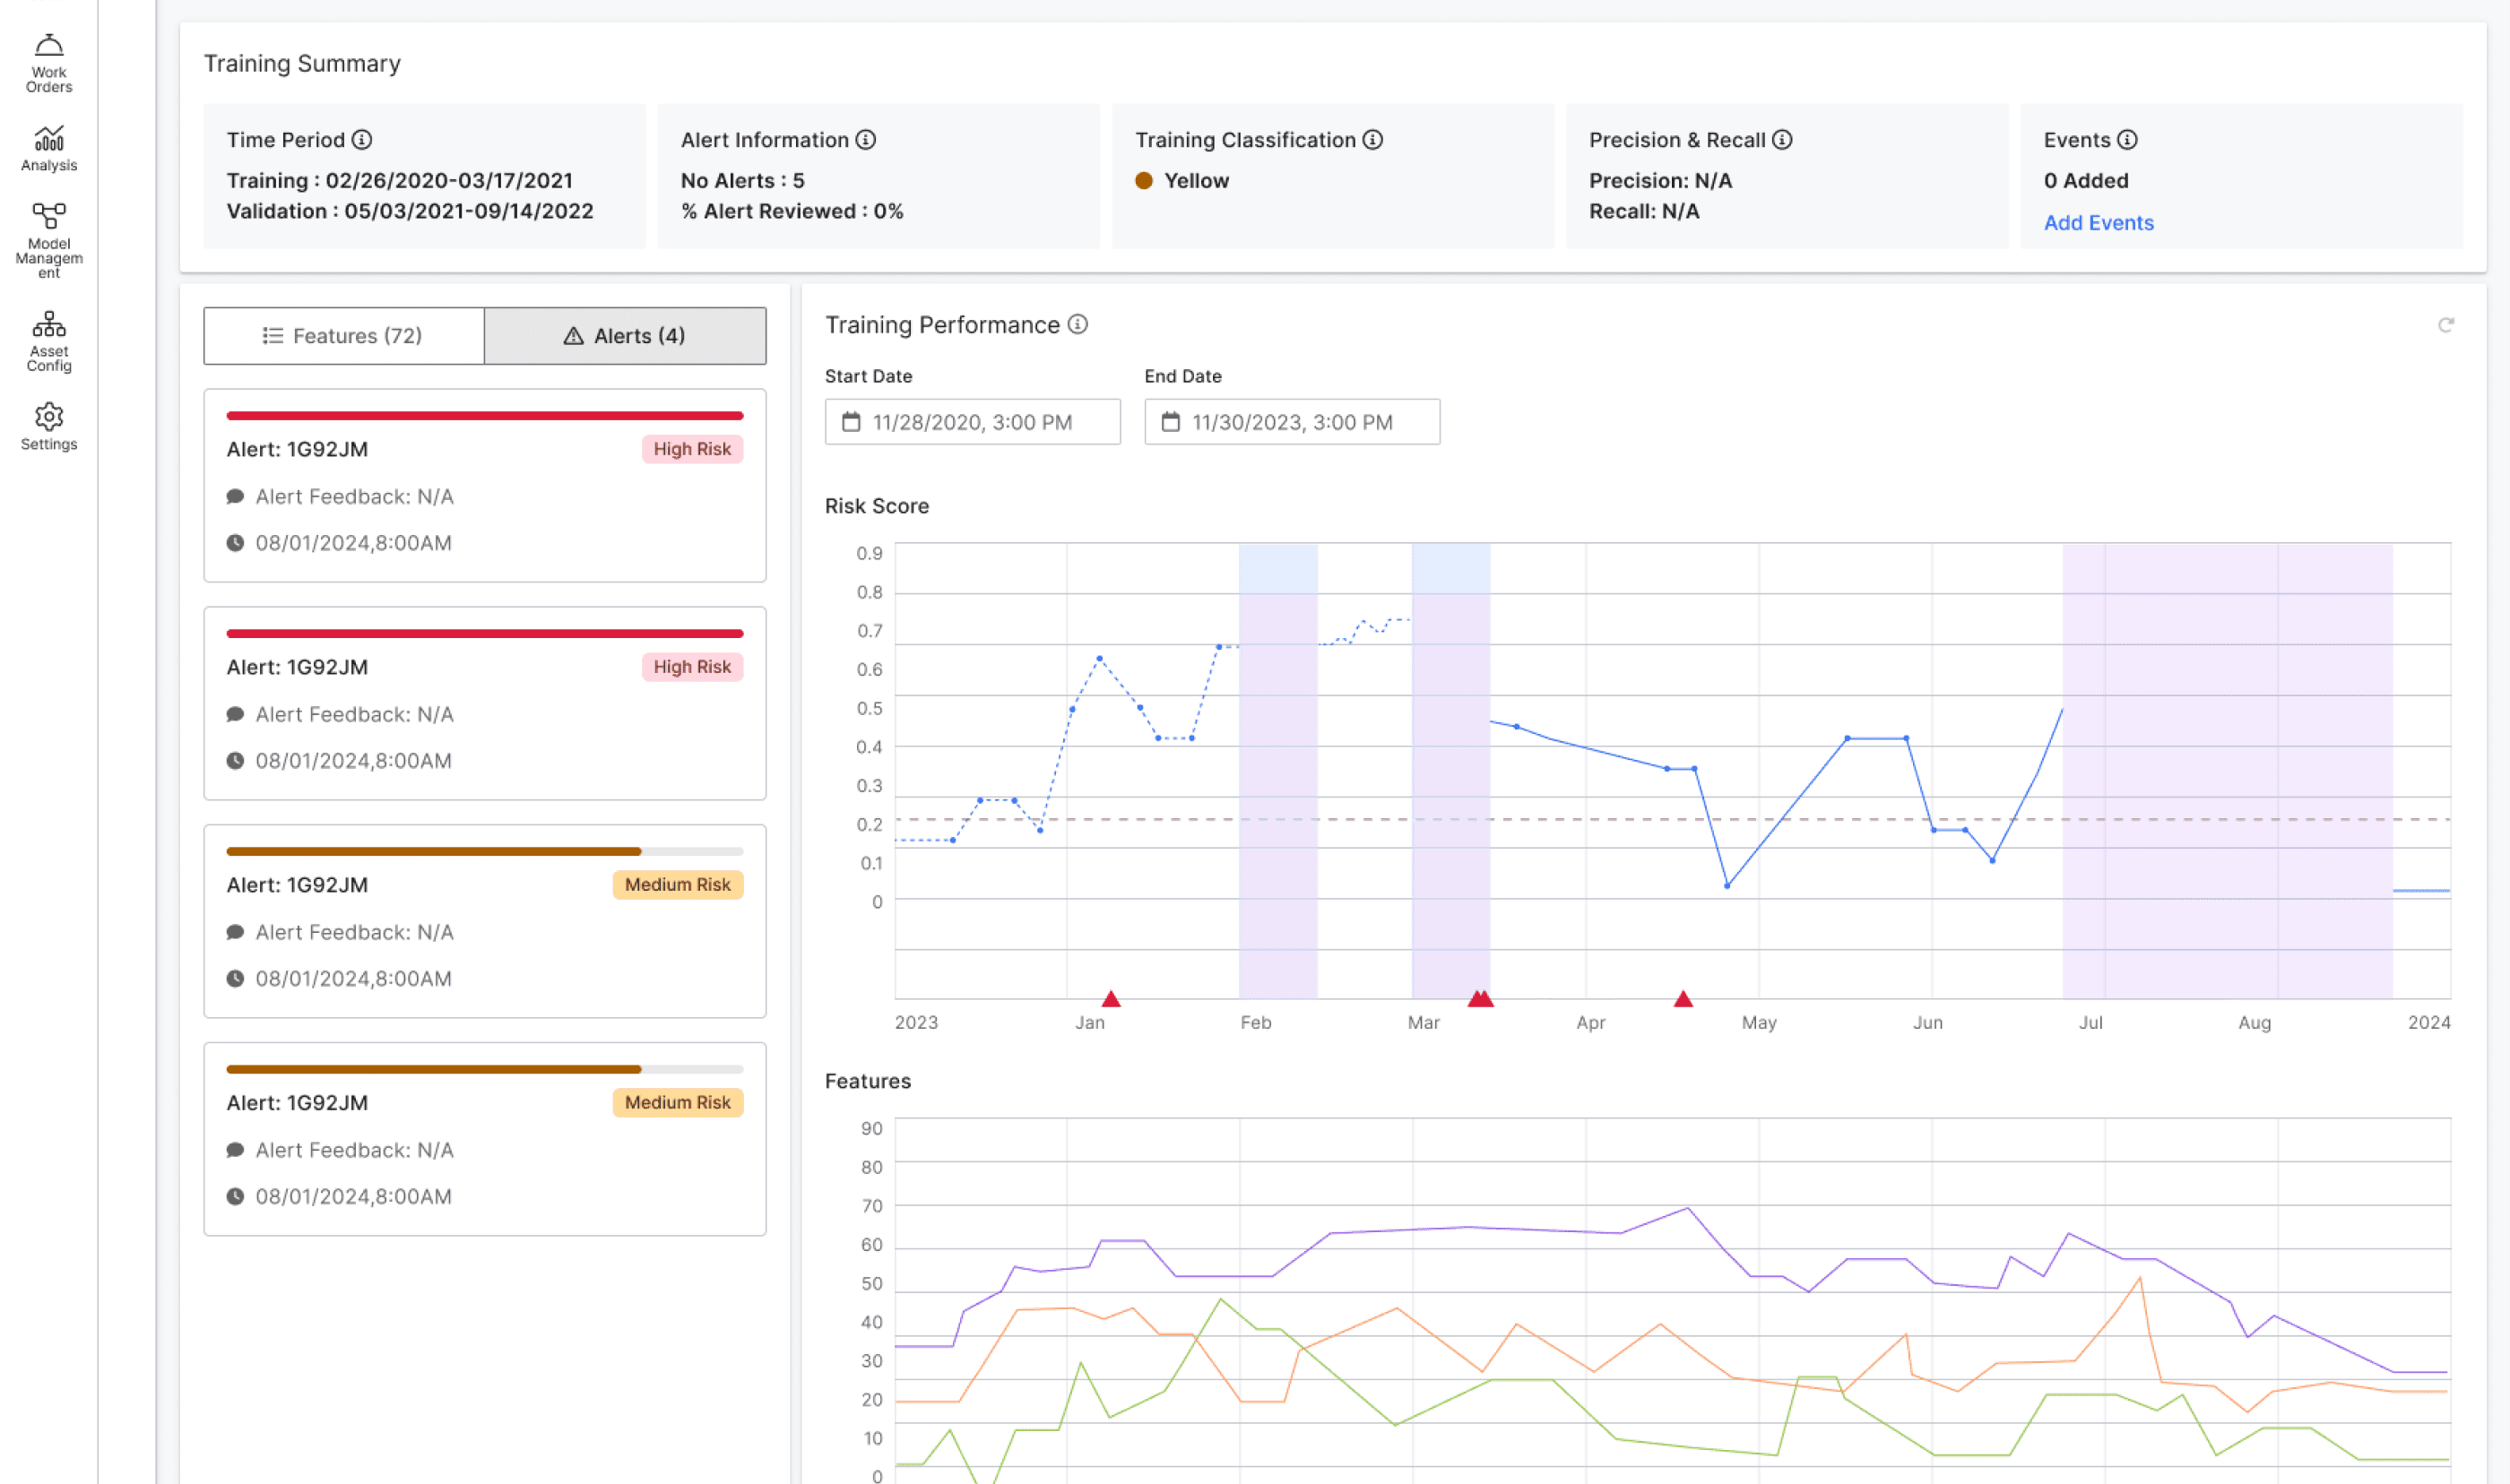
When I analyzed the validation process, I noticed that reviewing model features and alerts was a major bottleneck. Each model had over 20 features and could generate 10+ alerts, making it overwhelming for users to assess everything efficiently. To streamline this, I focused on helping users absorb key insights quickly without losing depth. I explored solutions like visual summaries, interactive filters, and smart alert grouping to highlight critical information, enabling users to focus on what matters most.
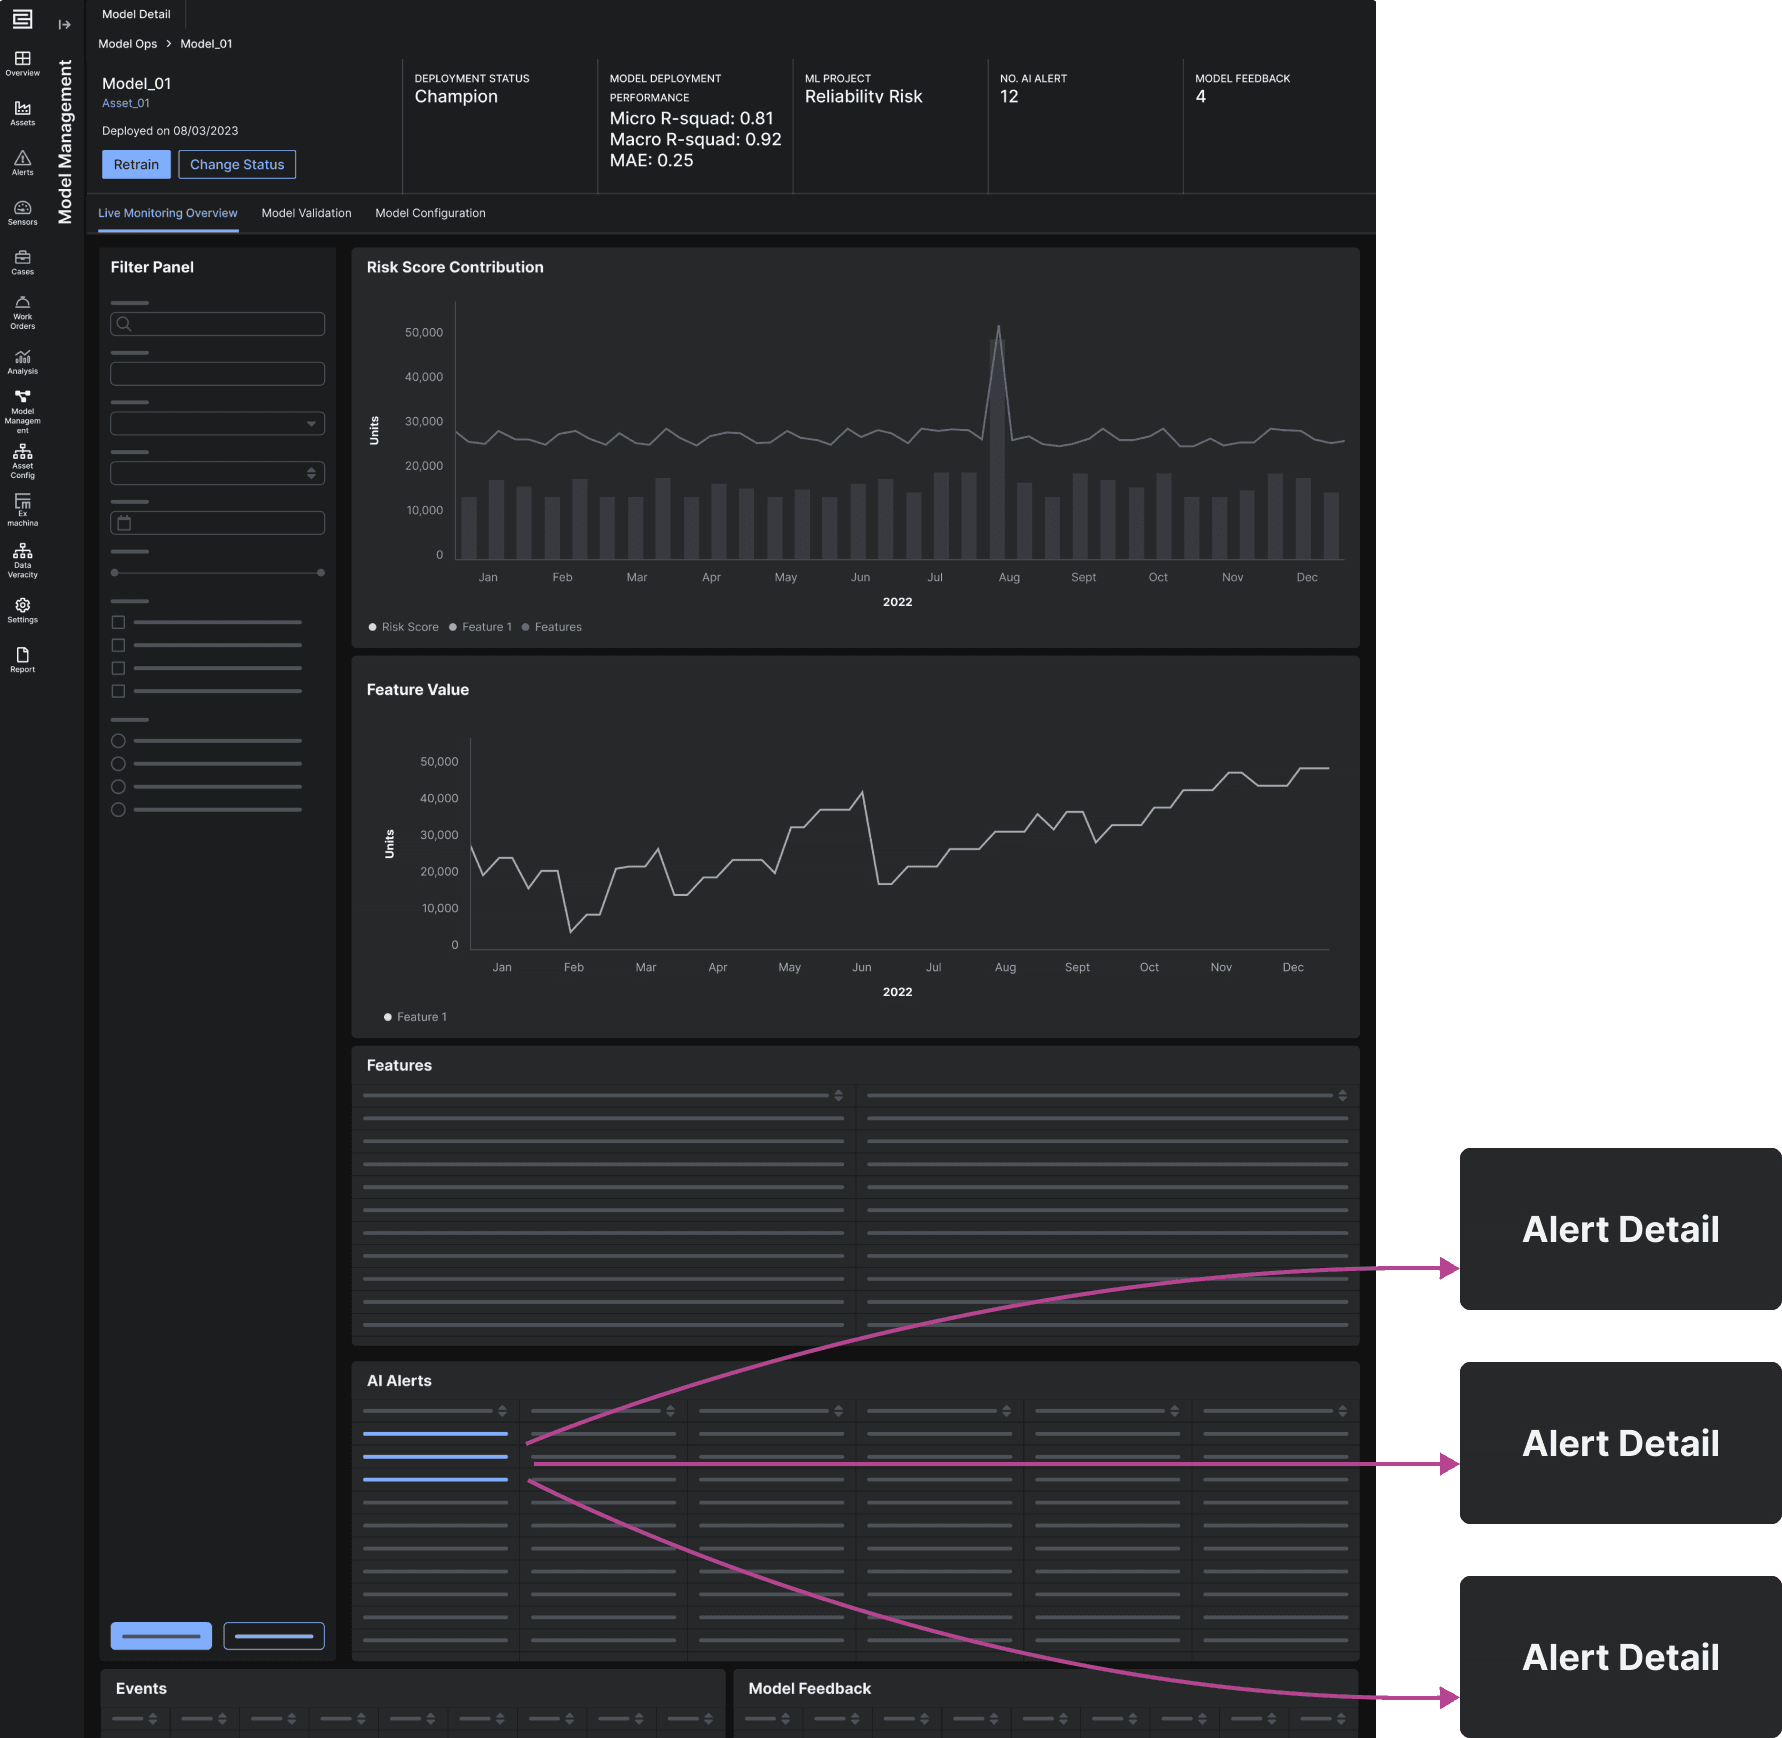
Option 1
Replicate the Model Live Monitoring Page, have a dedicated alert detail page for alert validation
check_circle
Easy to implement
cancel
Need to scroll back and forth to plot features, information overloaded
cancel
Disconnected experience for review features for each alert
cancel
Another alert detail layer is too heavy for the quick validation flow
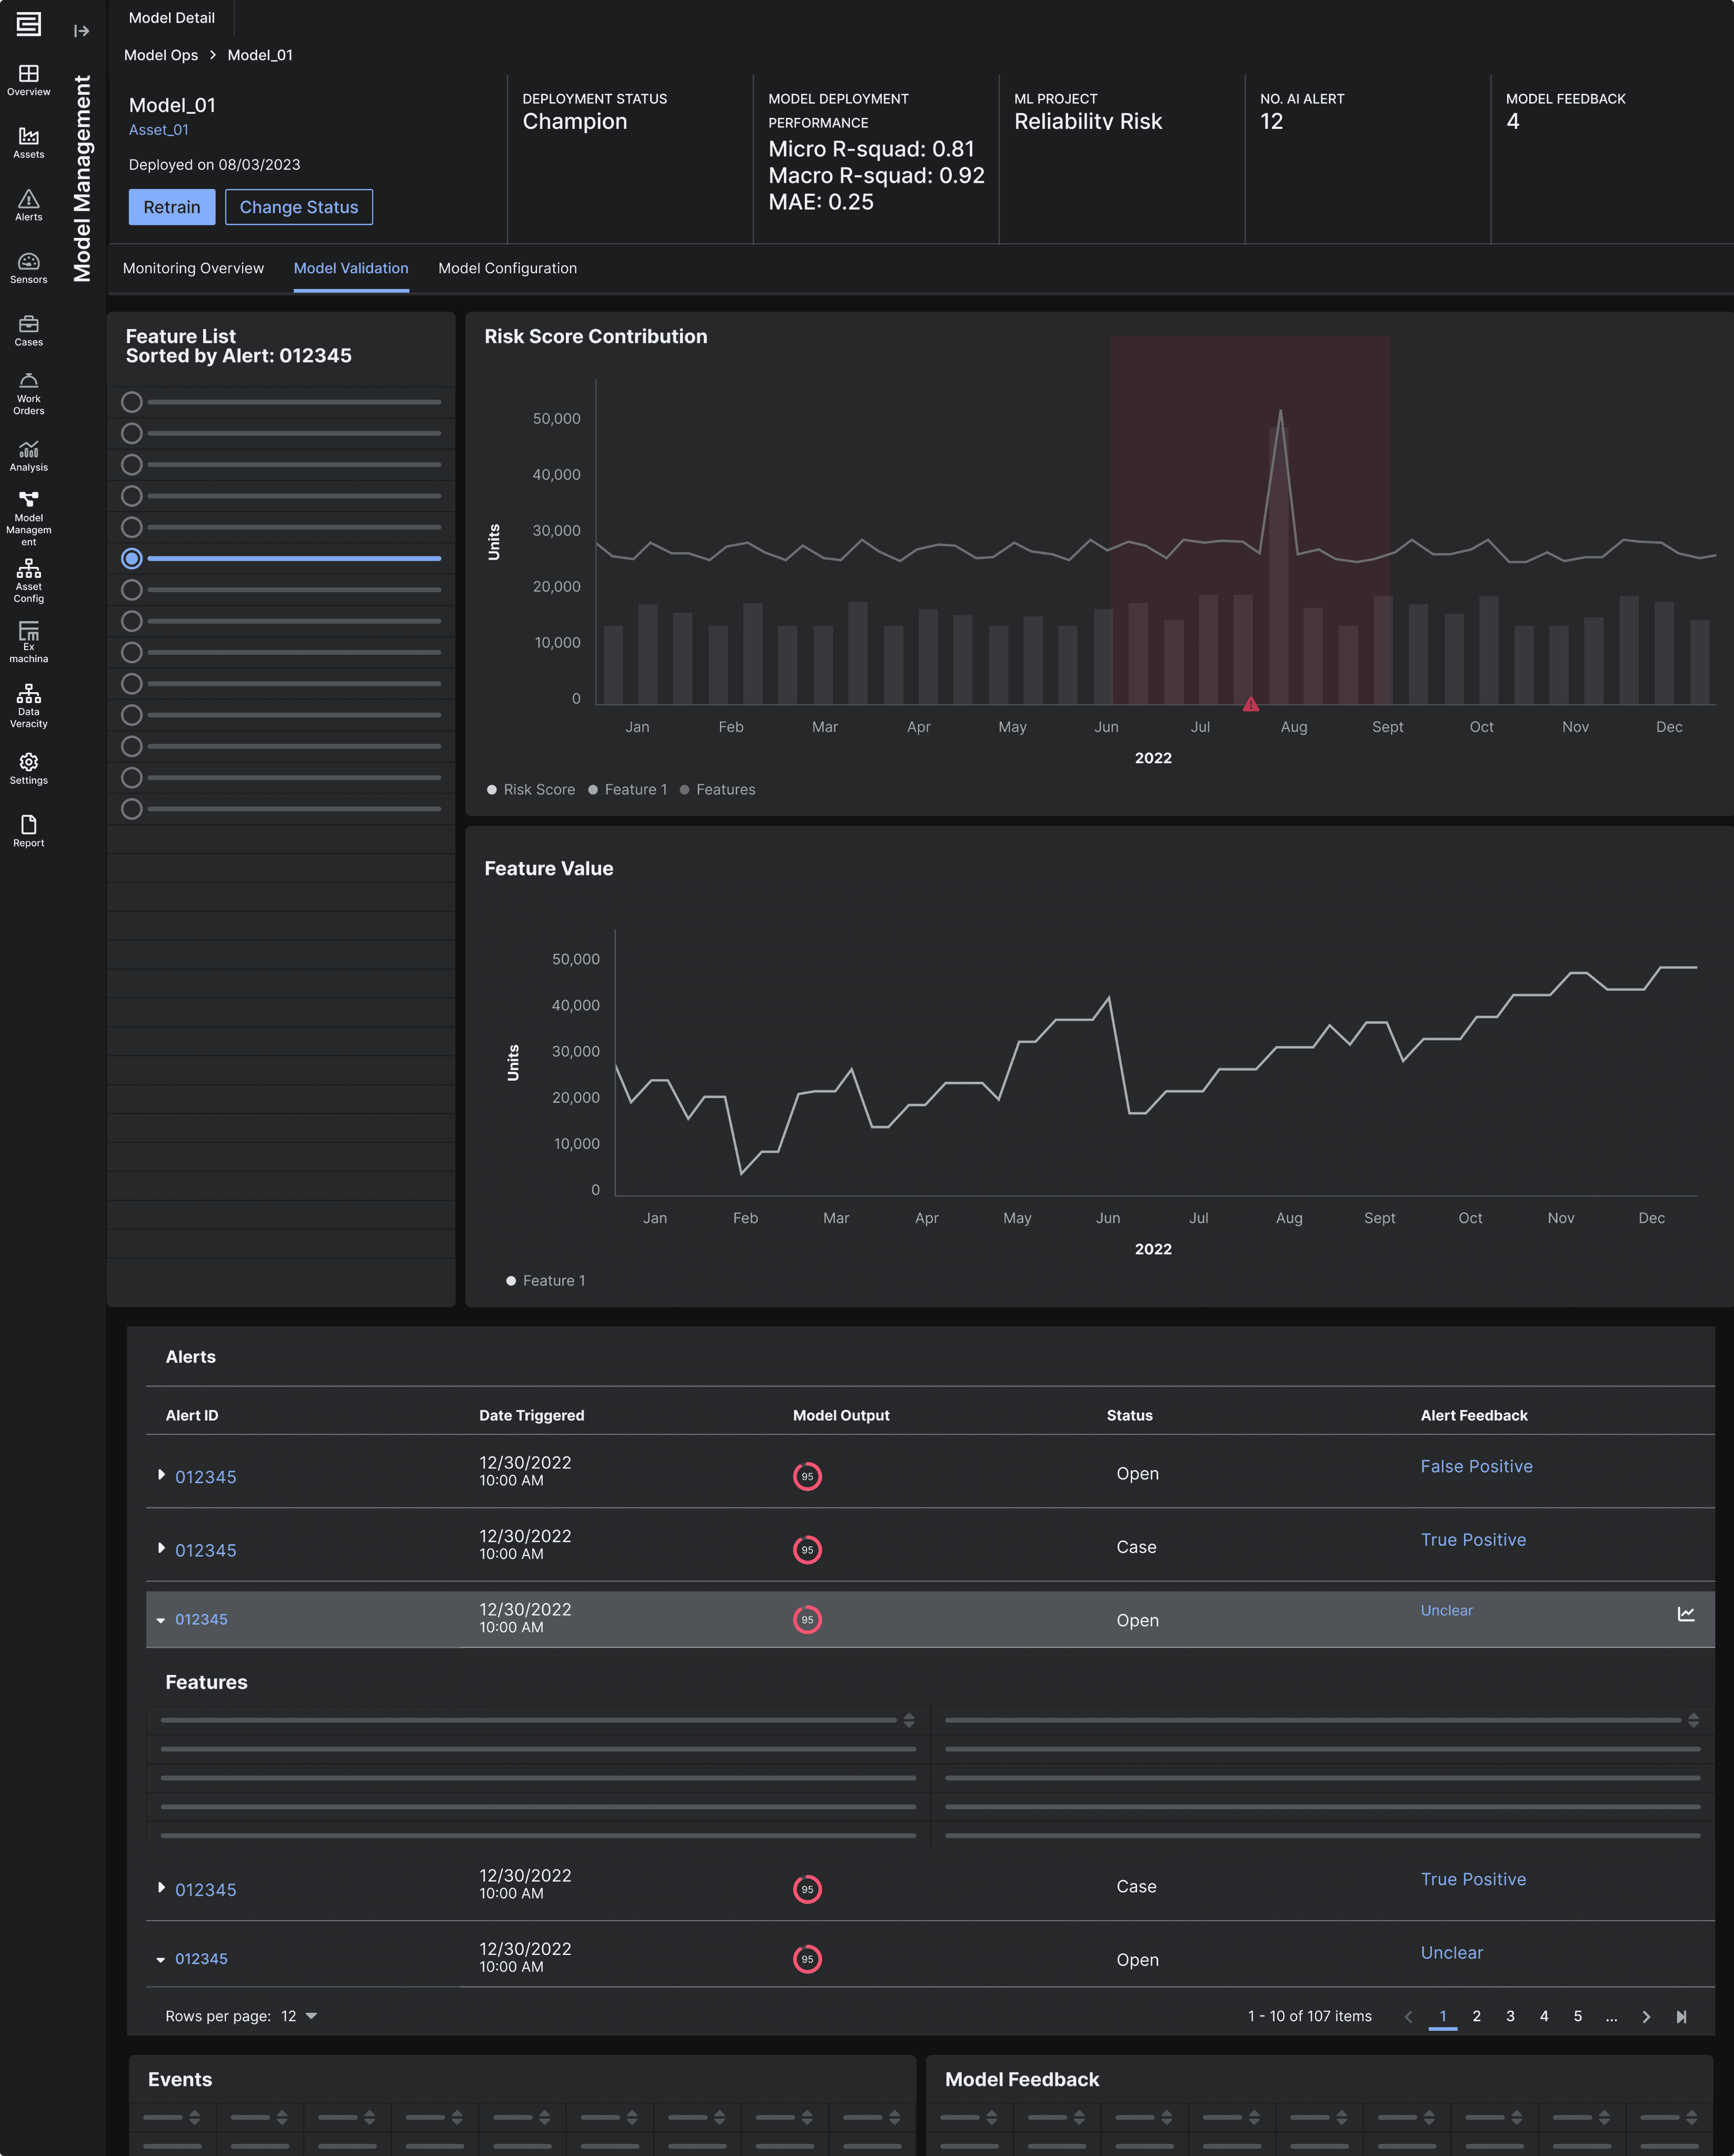
Option 2
Feature List and Plots side by side,
Zoom in Alert in feature list and chart
check_circle
Easy to implement
check_circle
Reduce scrolling when plotting features
cancel
Redundant feature data in one page for features and alert
cancel
Actions are scattered
Option 3
Feature List and Plots side by side, switch features and alerts in side panel
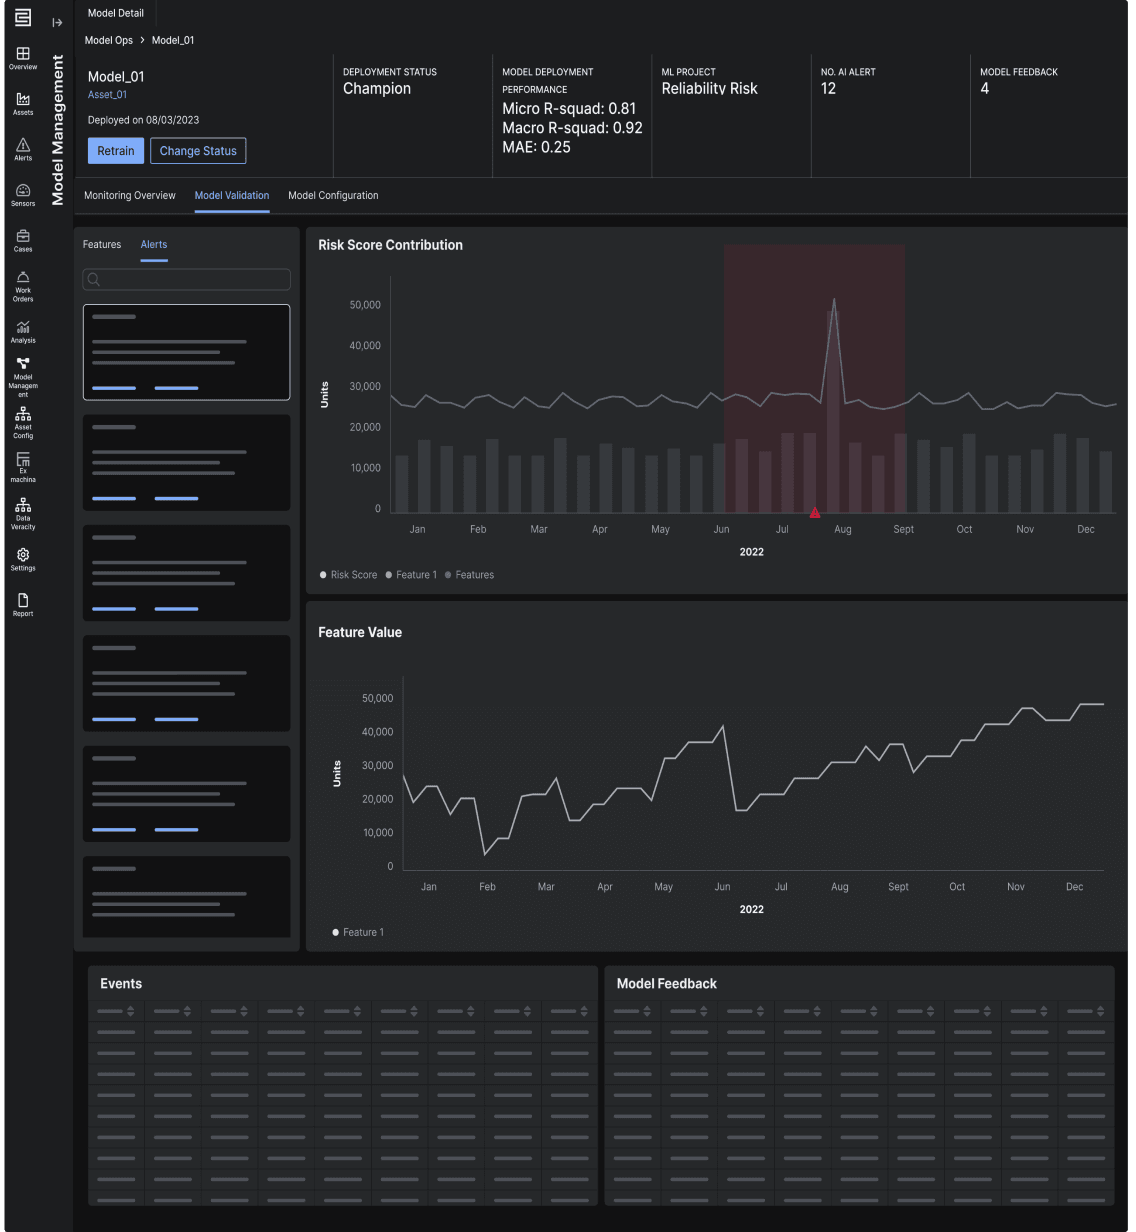
check_circle
Easy to follow the items need to be reviewed
check_circle
Reduce scrolling when plotting sensors and alerts
check_circle
Reduce redundant information
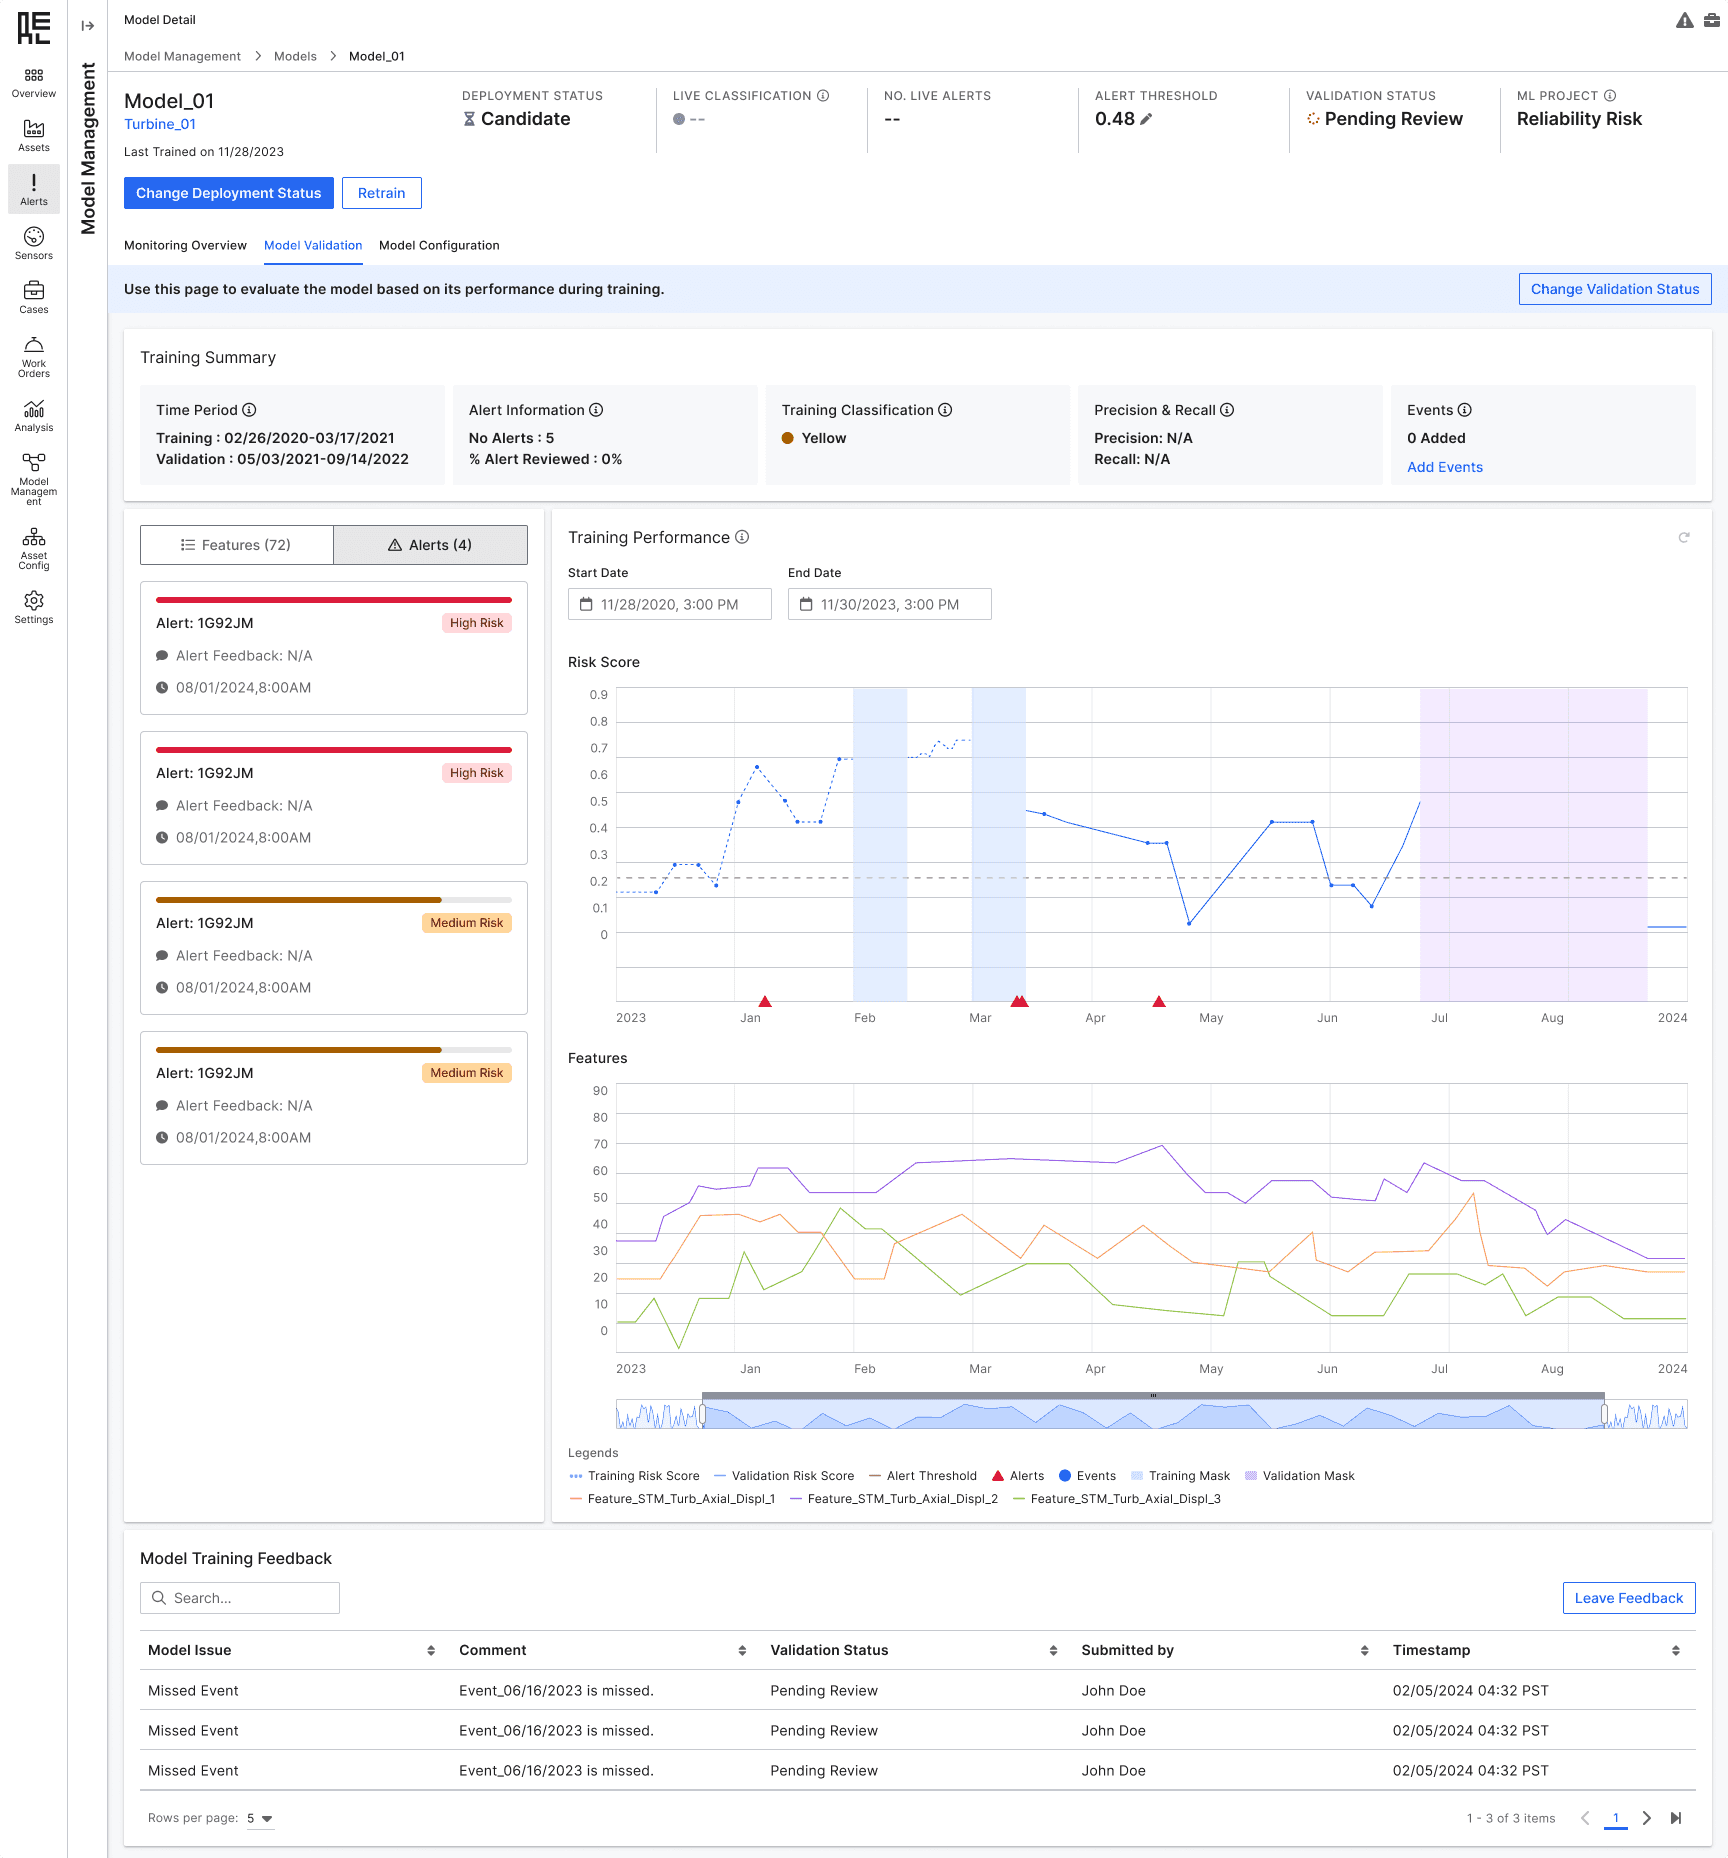
Refine the designs
Design Decision
Users needed a quick way to visualize features and alerts to spot patterns.
The final design displays features, alerts, and a chart side by side, with a toggle for focus. Users can plot features, find alerts, and label them instantly, streamlining validation.
Design Decision 3
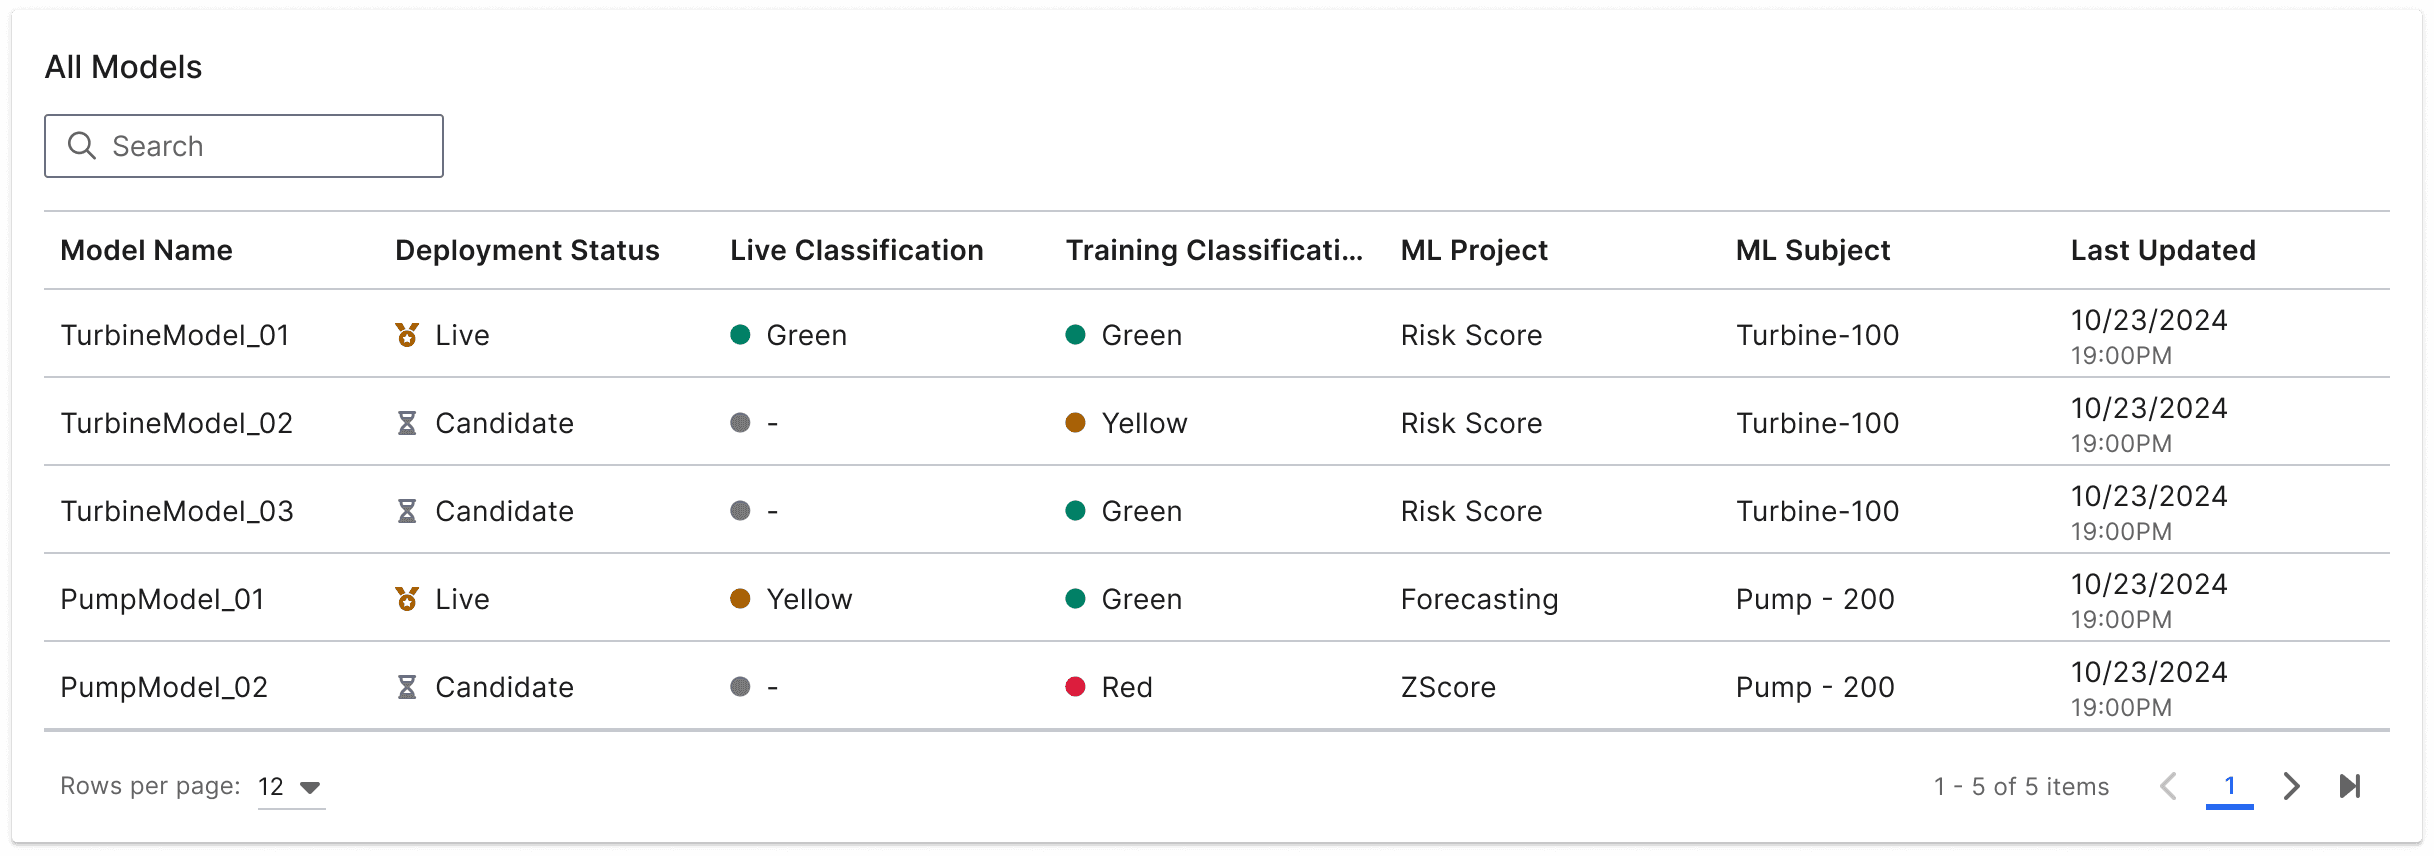
Design different paradigms for models w/ different deployment status
When designing for different model deployment statuses, I found that users needed tailored information.
Live models required real-time and historical data for performance assessment, while challenger and retired models only needed validation data. This led to a status-based navigation system, ensuring users see only relevant information, improving focus and efficiency.
Designing the Paradigm for Challenger and Retired Models
For challenger and retired models, I designed the experience to direct users straight to the Model Validation page, ensuring immediate access to relevant data. A contextual message explains why validation is the focus, reducing clicks and helping users quickly assess historical performance.
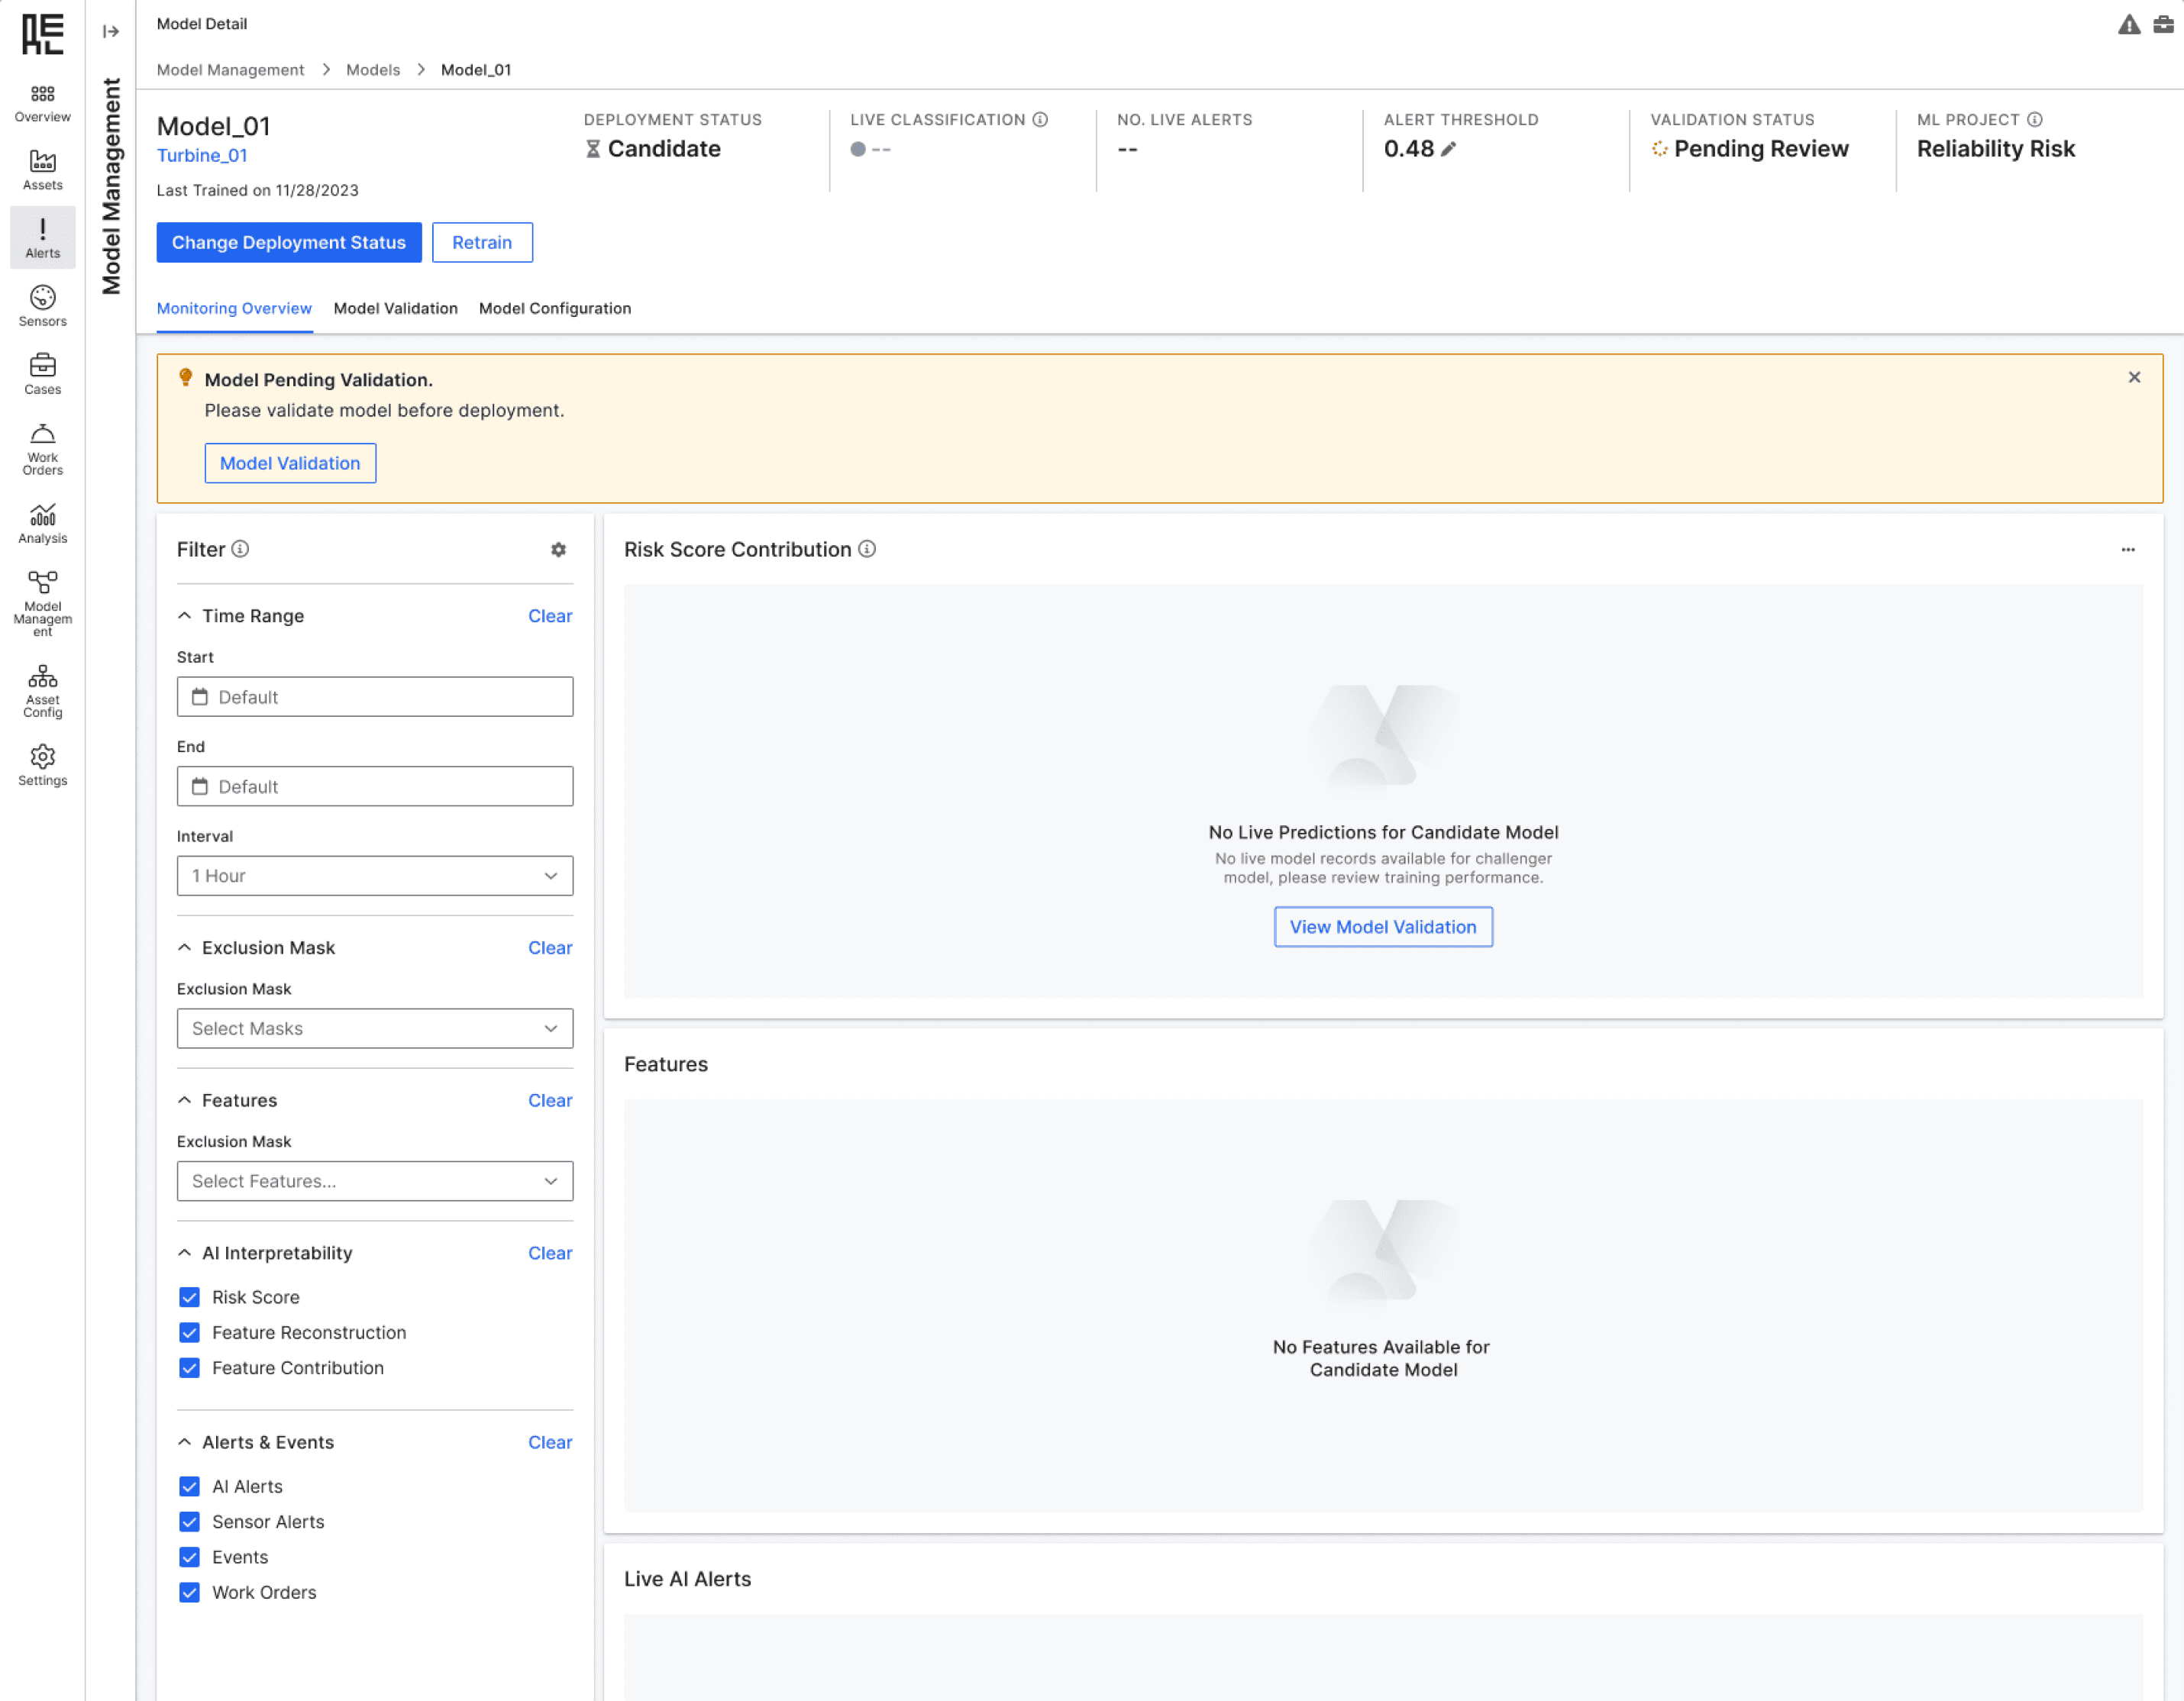
Show Validation Status
Prompt users to validation flow
Addressing Live Models with Distinct Sections for Live and Validation Data
For live models, the challenge was clarifying the difference between live data and validation data. I solved this by adding separate tabs for each, with color-coded labels and icons for quick recognition. Tooltips next to each tab provide context, helping users know when to focus on live metrics or validation insights, enhancing clarity and decision-making.
Add visual cue to differentiate validation
and live data
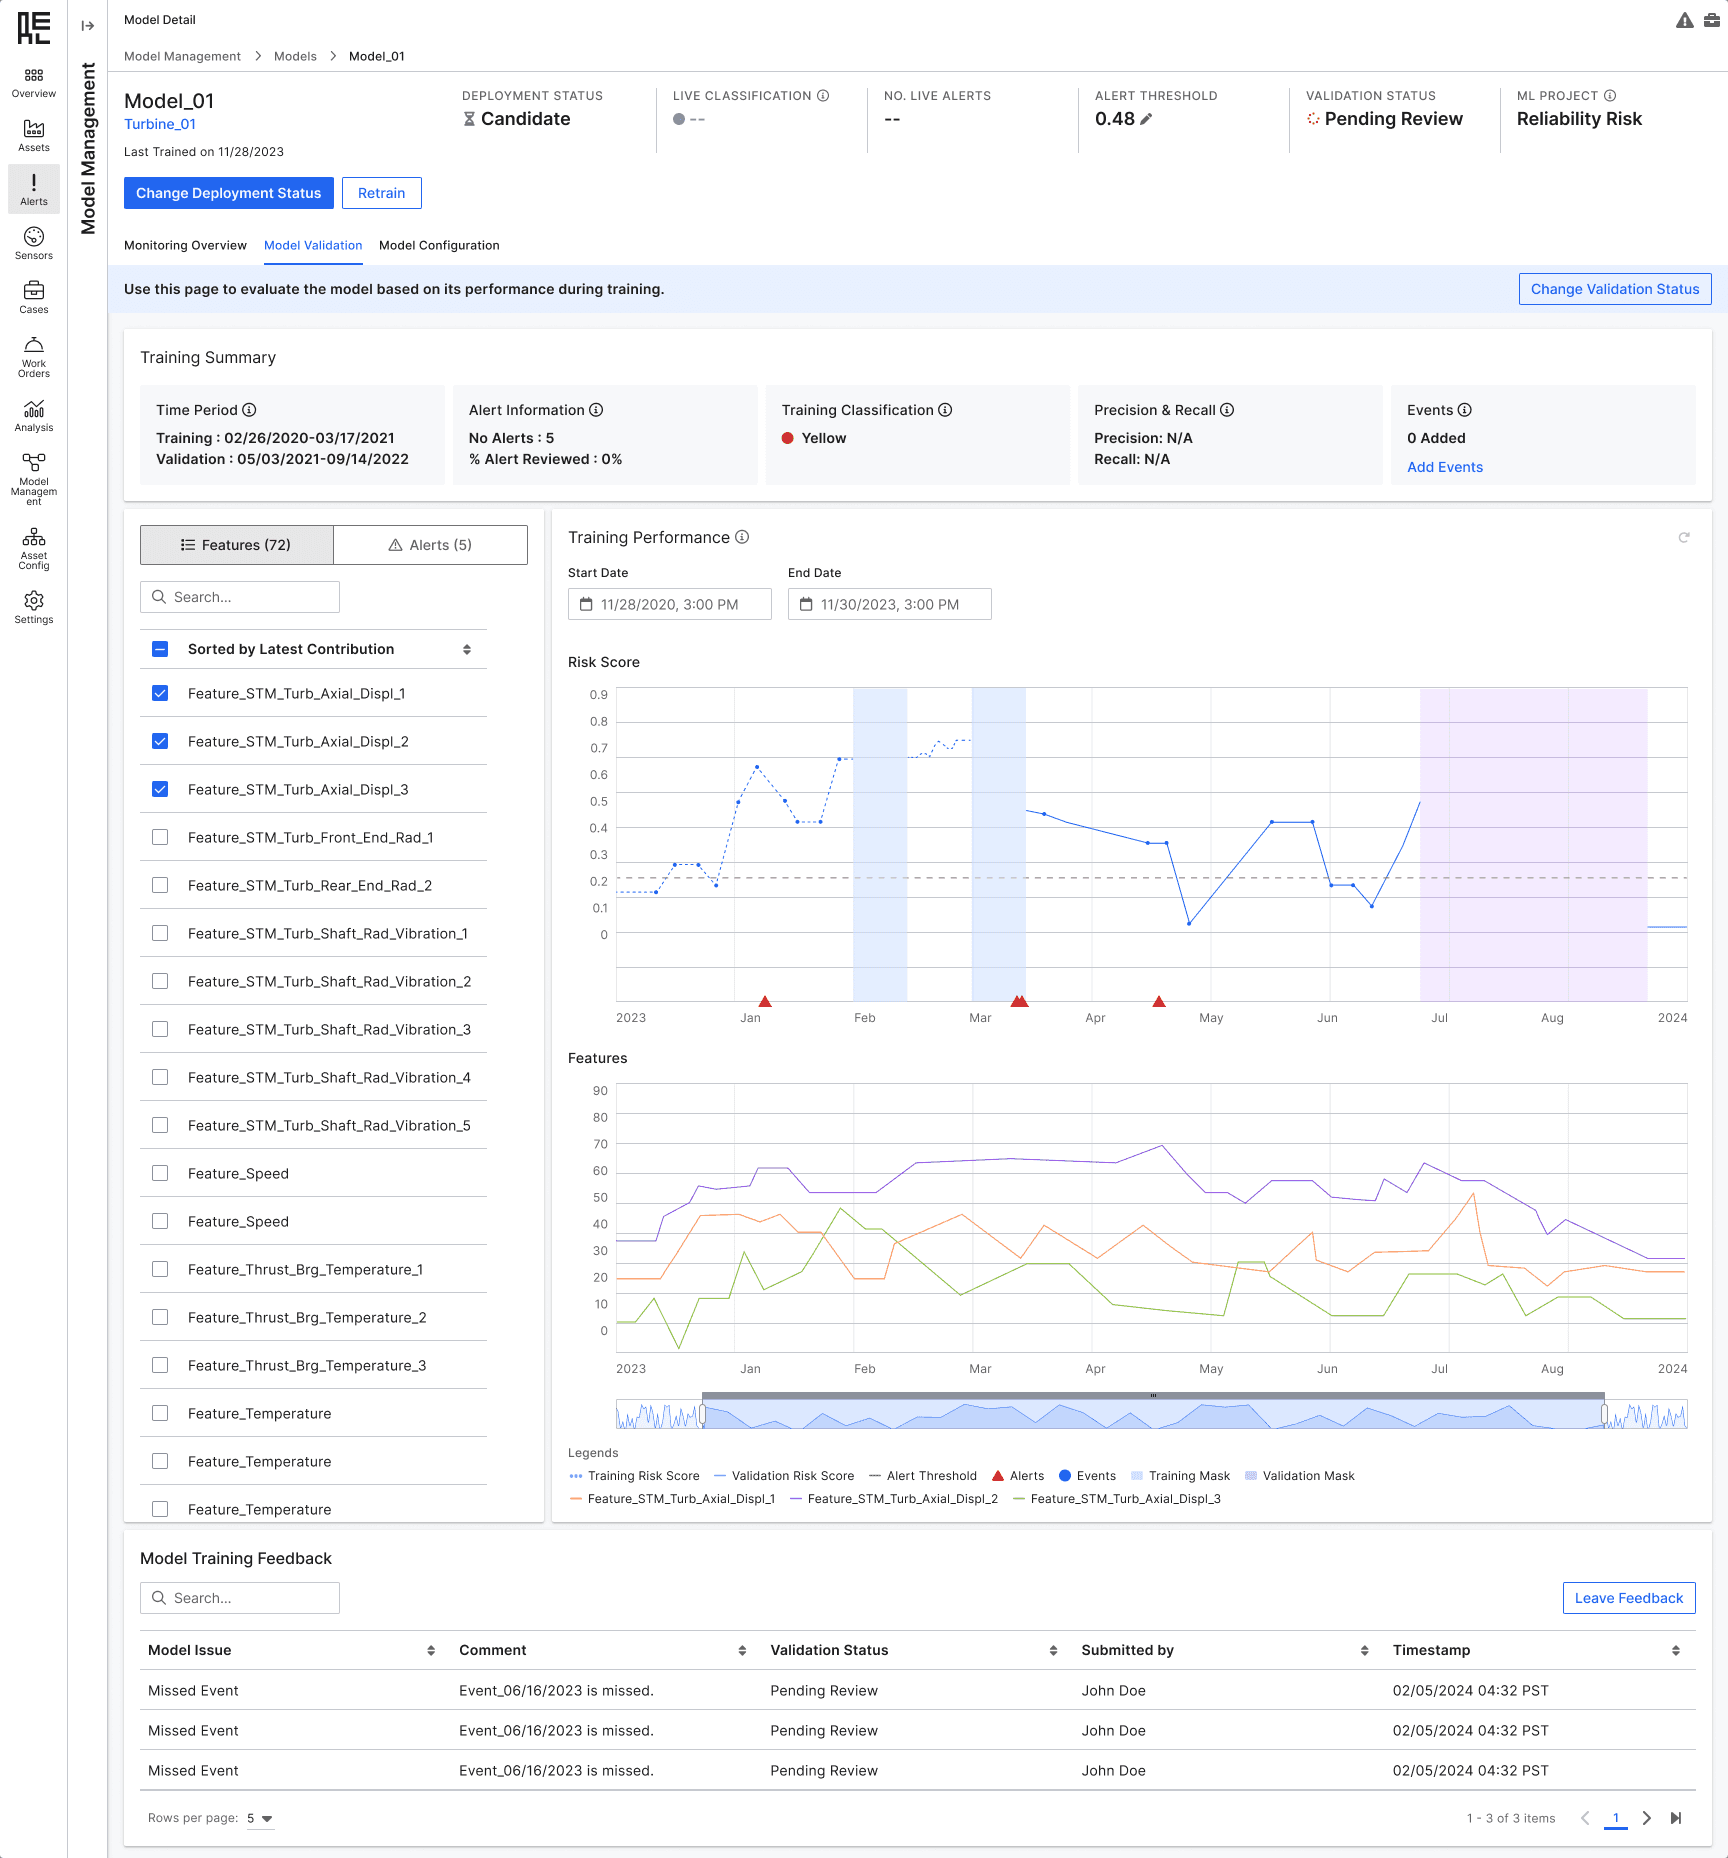
Design new layout that caters to needs for validation
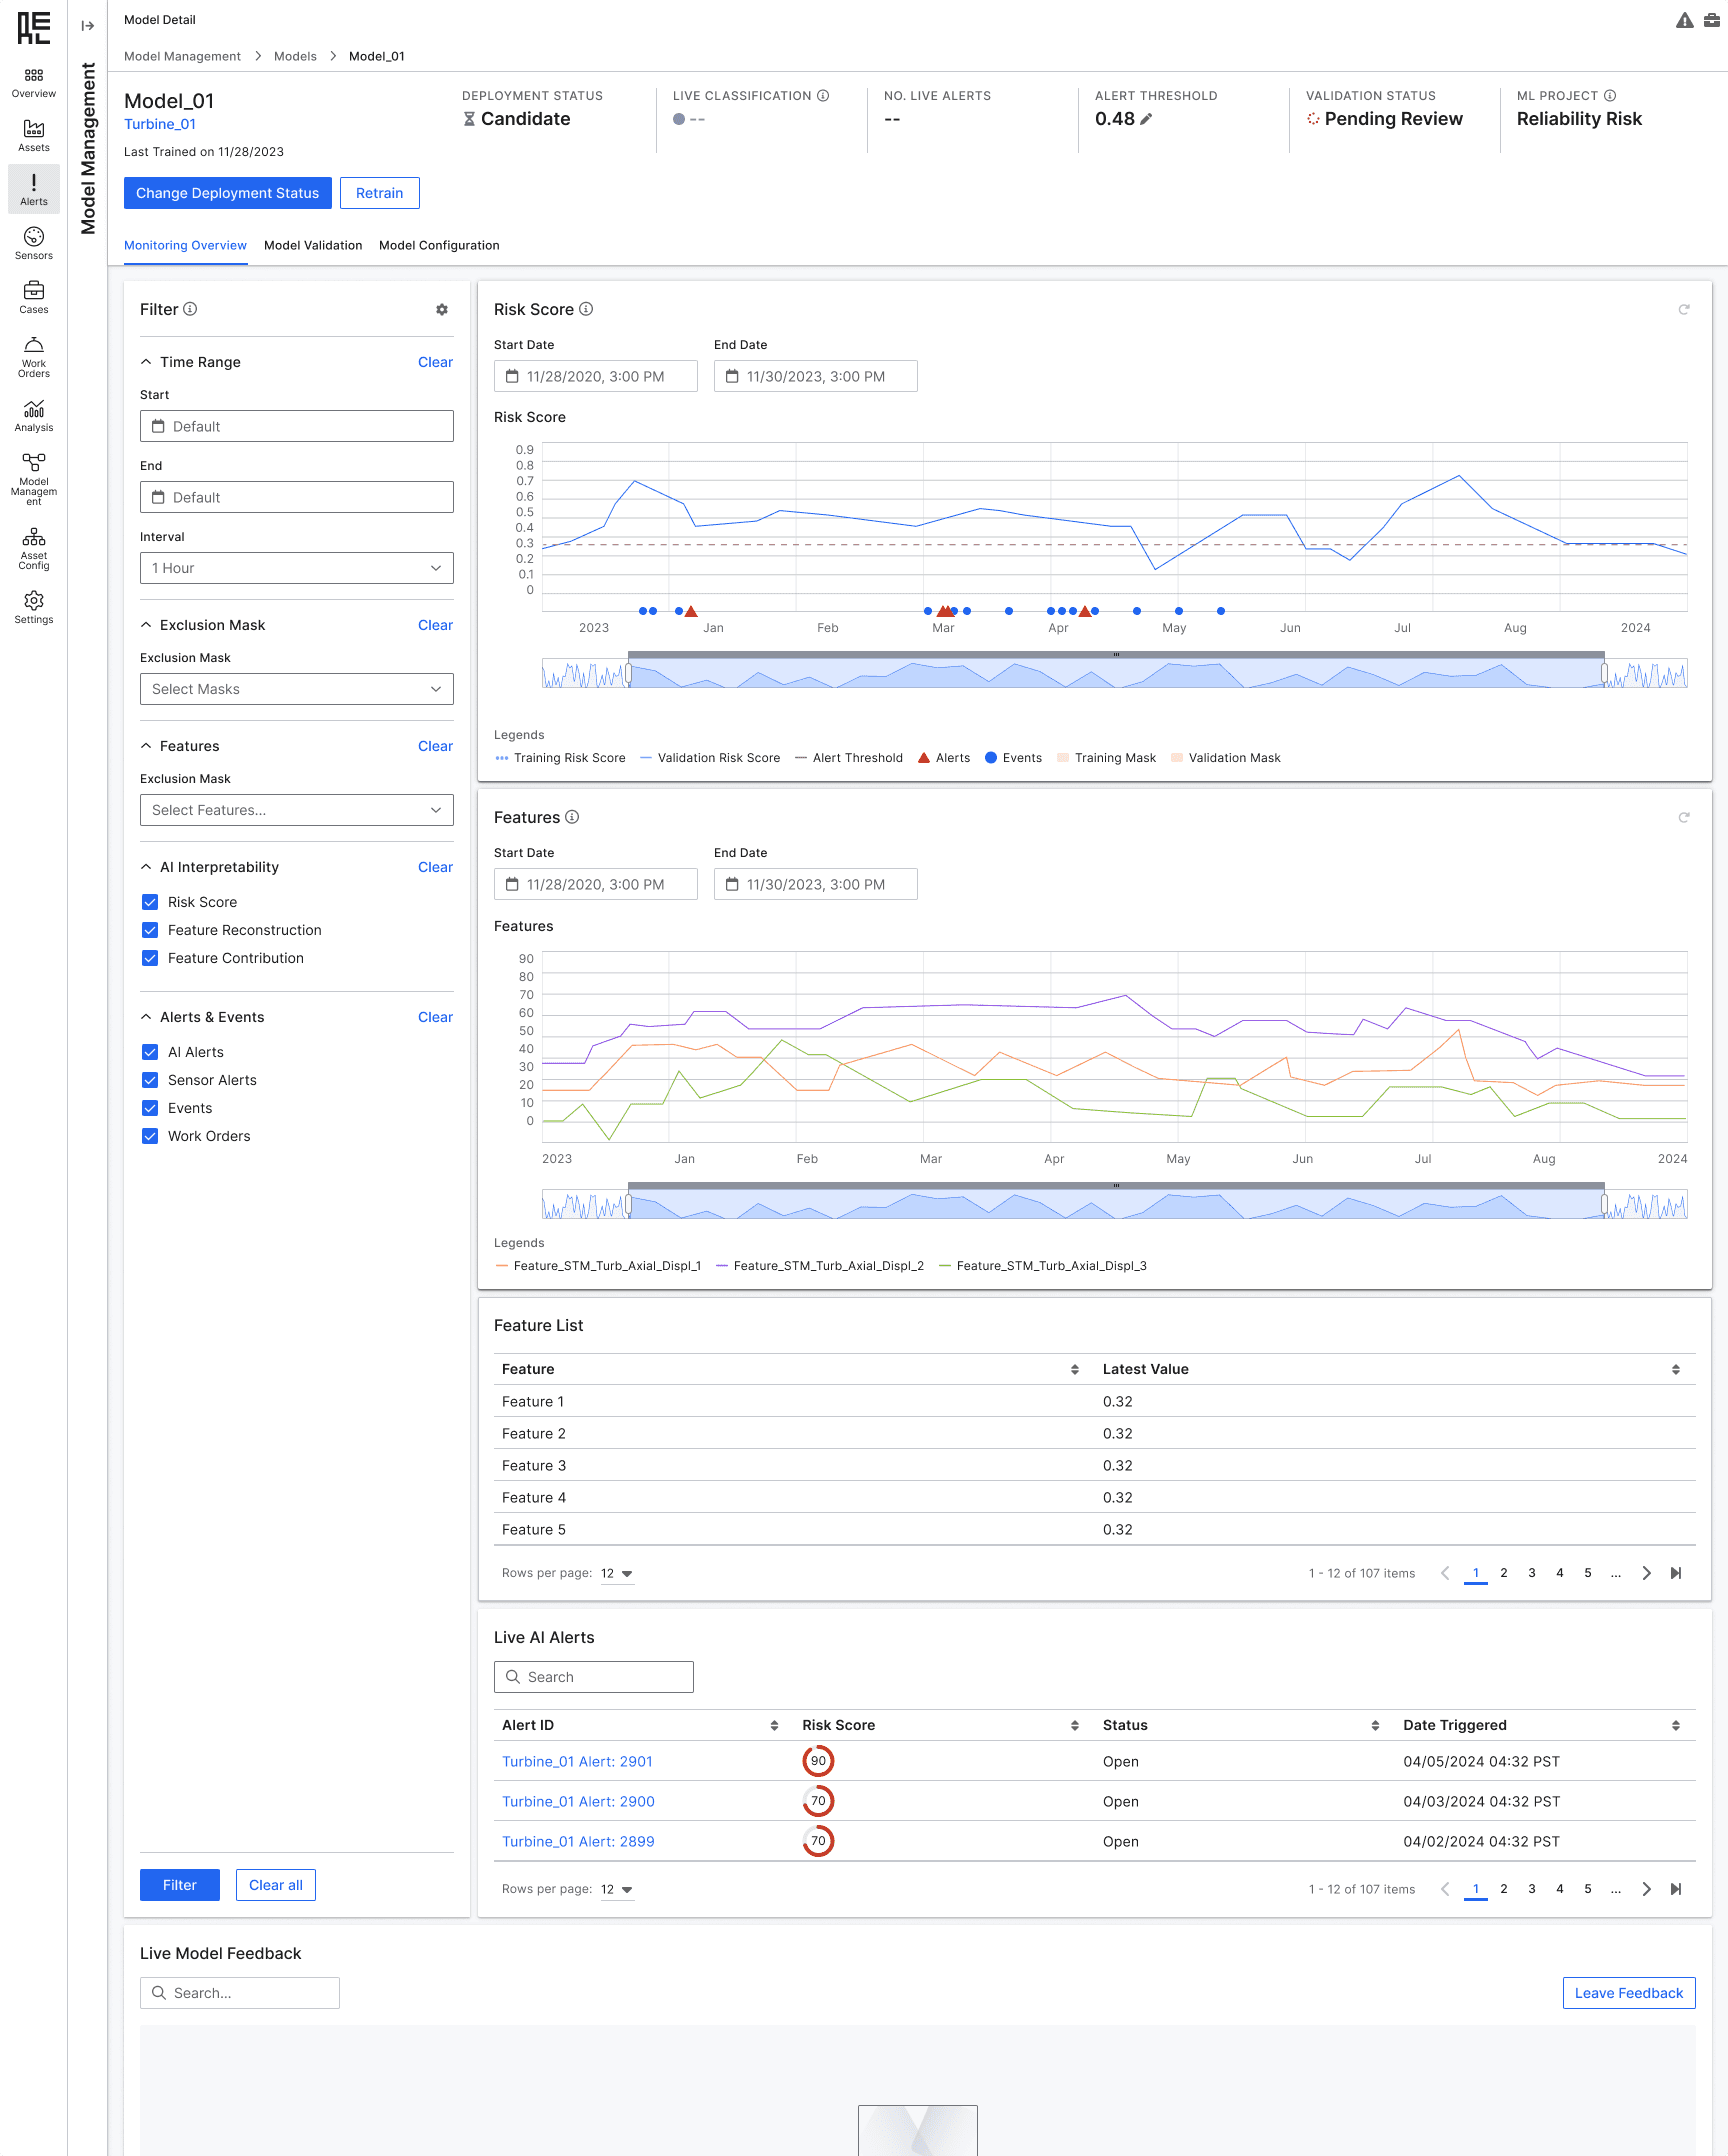
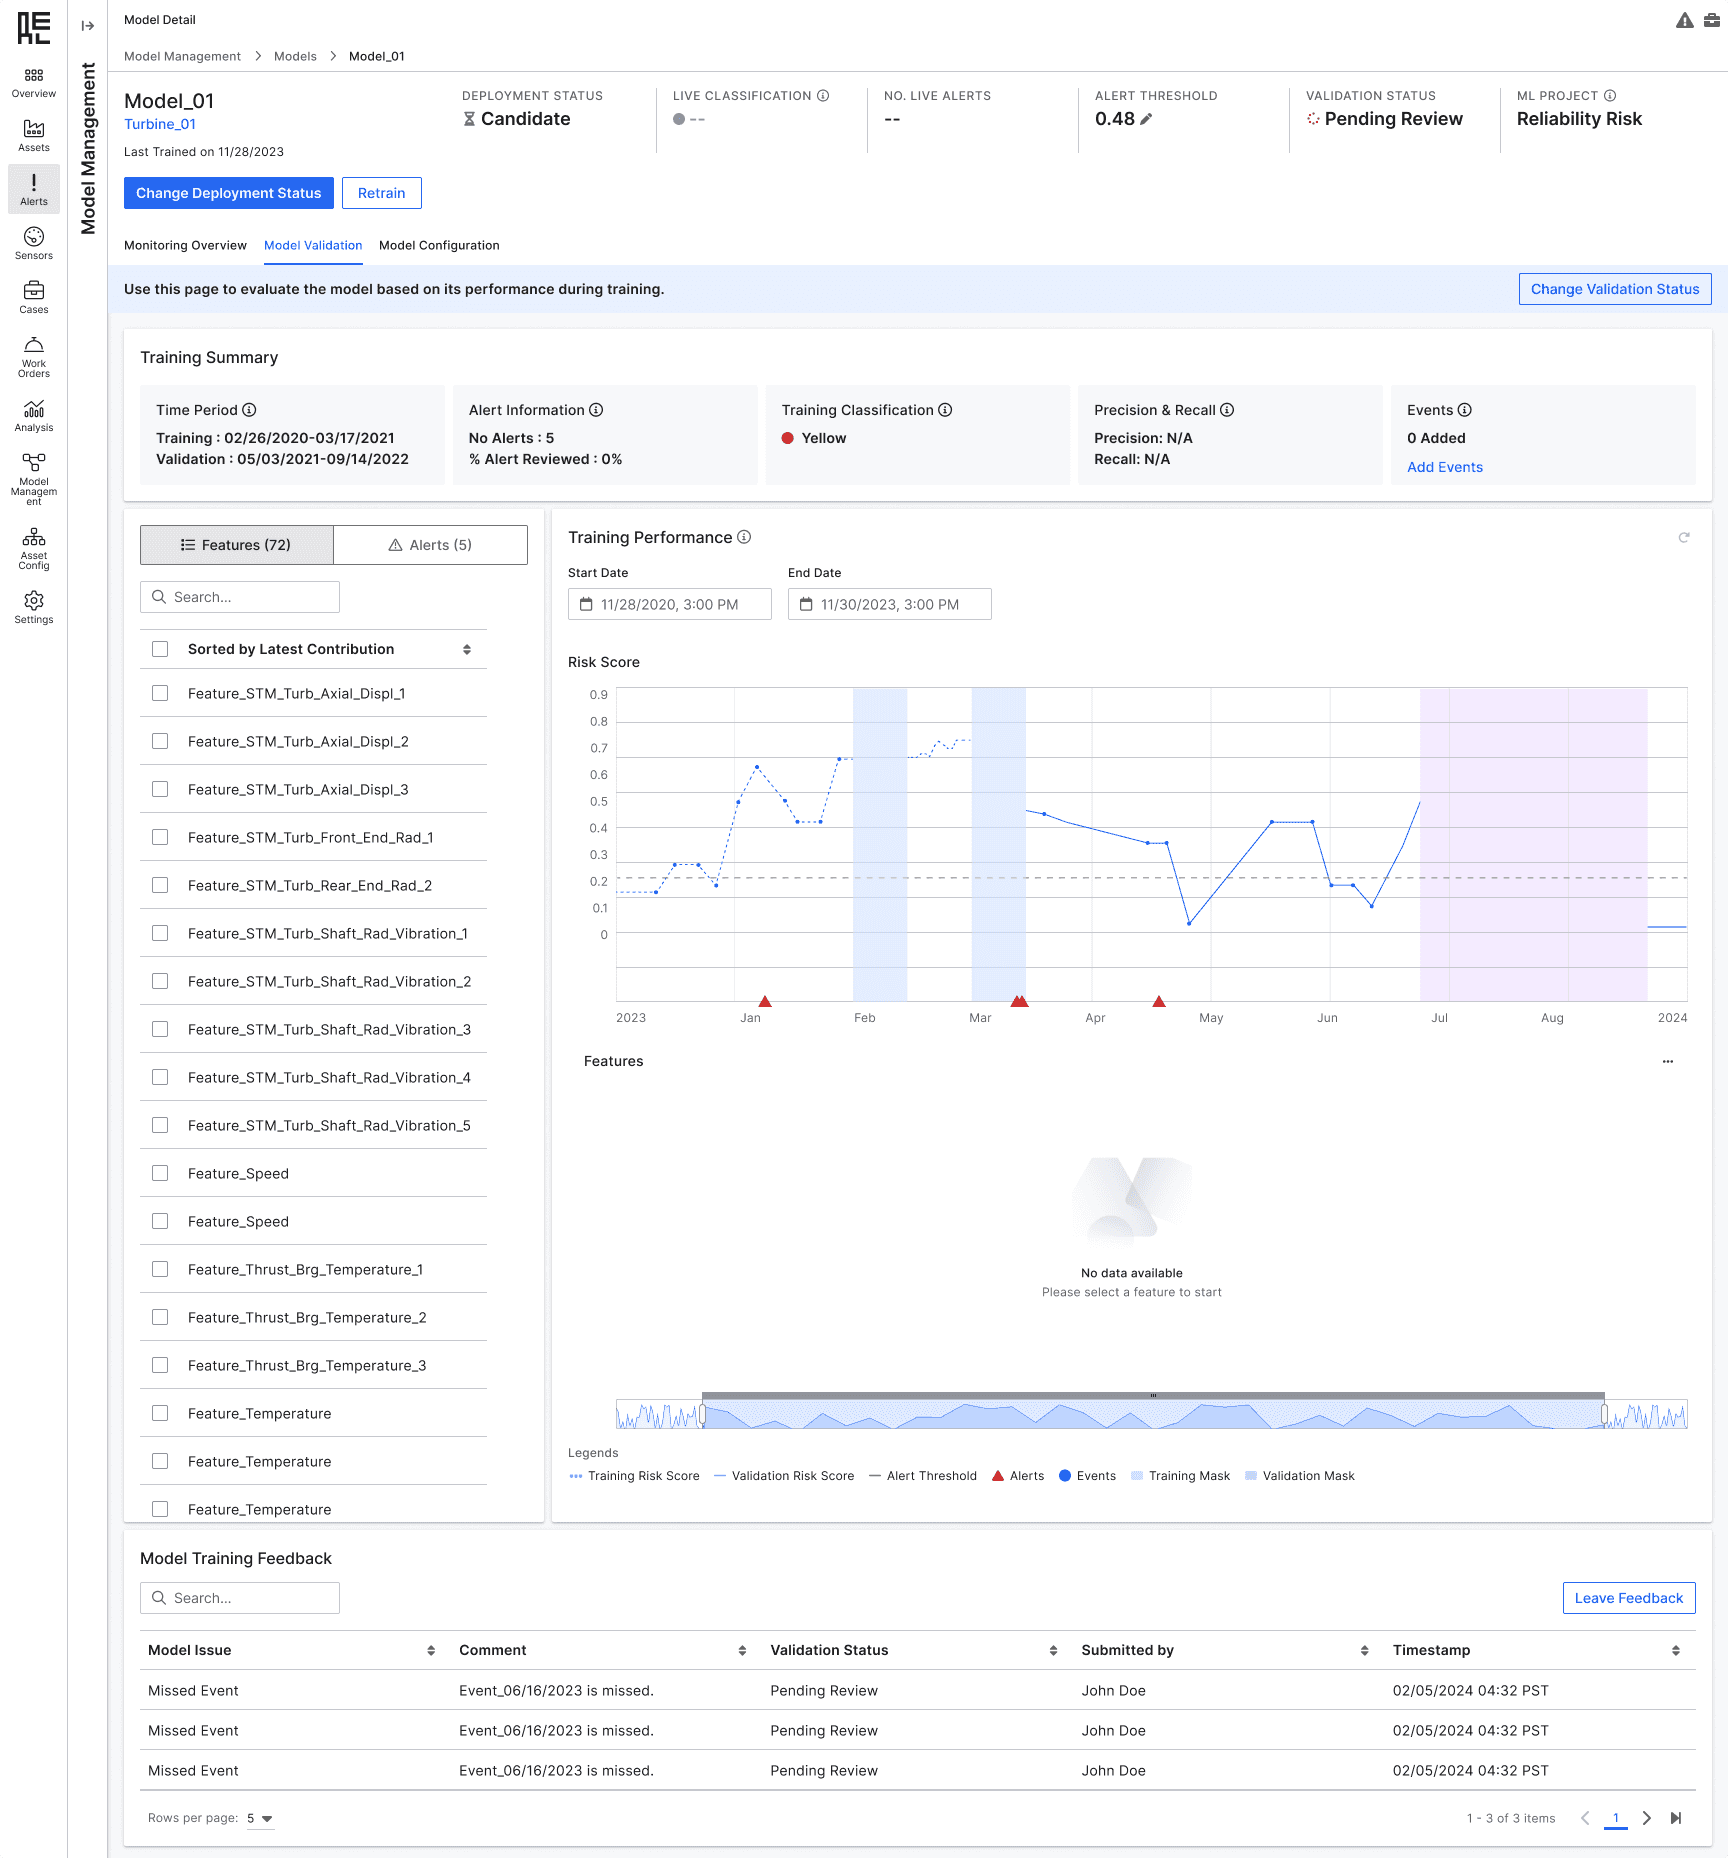
Final Solution
Introducing Reliability Model Validation
Impact
Driving Validation Accuracy and Client Satisfaction with Model Validation
After launching the model validation feature, we tracked key metrics like validation accuracy, decision confidence, and model promotion success rate through in-app analytics. These insights showed how the feature improved validation and reduced support requests.
Major customers, including Shell, ExxonMobil, Dow, Holcim, and Cargill, praised its ability to streamline workflows and enhance data-driven decisions. Within three months, 100+ active users adopted the feature. Field teams also highlighted its impact on contract renewals, as it simplified performance sharing with executives, boosting transparency and trust.
Thanks for Stopping By
Evie Xu