OceanBase Database Management Platform @Alibaba

Overview
As part of my summer internship at Ant Financial (Alibaba Group), the largest FinTech company in China, I worked on a groundbreaking project to redesign the OceanBase Database Management Console. Collaborating with a cross-functional team of PMs, software engineers, and front-end developers, I led the design of a user-centric console for Alibaba Cloud.
Role & Duration
Product Designer
8 Weeks
Highlights & Stage
Developer Tool, Enterprise Product
Shipped 09/2019
Team Structure
2 UX Designers, 1 PM,
2 Engineering Teams
Alibaba OceanBase Database Management Platform simplifies and streamlines the entire lifecycle of database management, including setup, operation, and scaling, empowering database admin to efficiently handle their database needs with ease and scalability.
Background
From Internal Tools to Global Scale: The Challenge of Simplicity
OceanBase is a world-leading distributed relational database developed by Ant Financial. While it excelled technically, its usability was a challenge. Internally, DBAs (Database Administrators) operated it using seven non-intuitive tools and command-line interfaces.
When OceanBase expanded to serve global external users, it faced a new challenge: creating a simple, secure, and scalable system accessible to companies of all sizes. This required a complete overhaul, as the internal tools weren’t fit for public use. My task was to redesign the management console from scratch, ensuring it was intuitive and productive for users ranging from small businesses to large enterprises.

Our Vision: Redefining Database Management for Everyone
Simplify and Optimize DBA Workflows:
The goal was to create a web-based console that reduces complexity, improves productivity, and provides an intuitive user experience. Instead of relying on multiple tools and manual command-line operations, the new console would centralize key functions and streamline workflows.
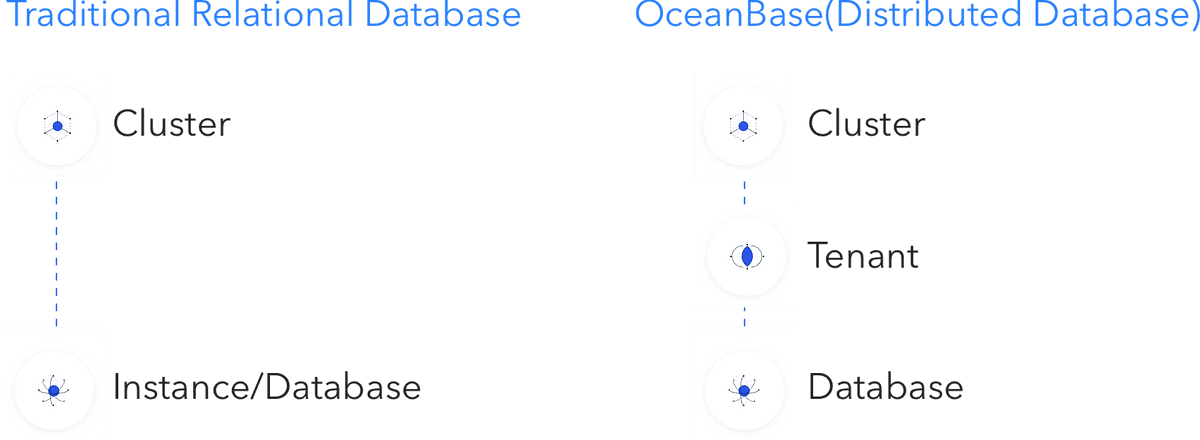
Adapt to User Mental Models
OceanBase’s hierarchy (Cluster → Tenant → Database) differs from traditional relational databases that typically use only two layers (Cluster → Database). A critical design challenge was to help users, especially those new to OceanBase, adapt to this new structure without confusion.
Final Design Overview
Delivering Seamless Experiences: Key Features of the Final Design
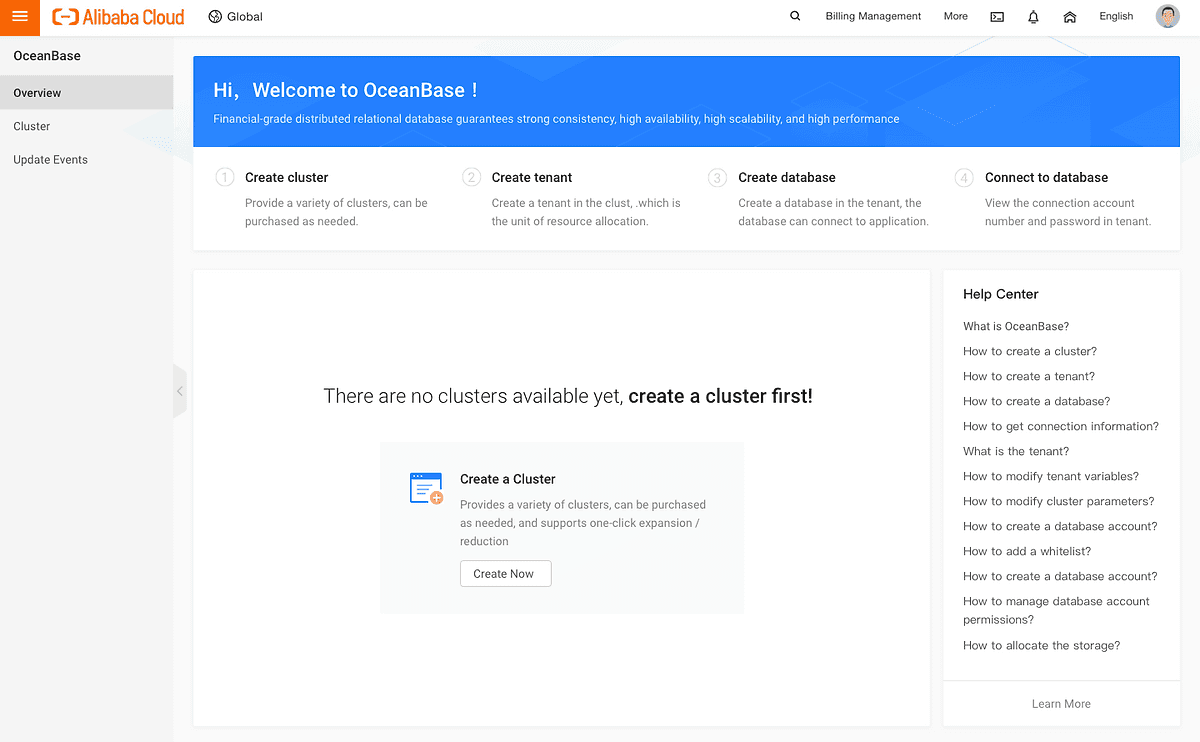
Welcome Screen: Avoiding the Mental Gap
To ease onboarding, the welcome screen provides a clear overview of OceanBase’s workflow, guiding new users step-by-step. An integrated Help Center acts as a reliable resource for troubleshooting and learning.
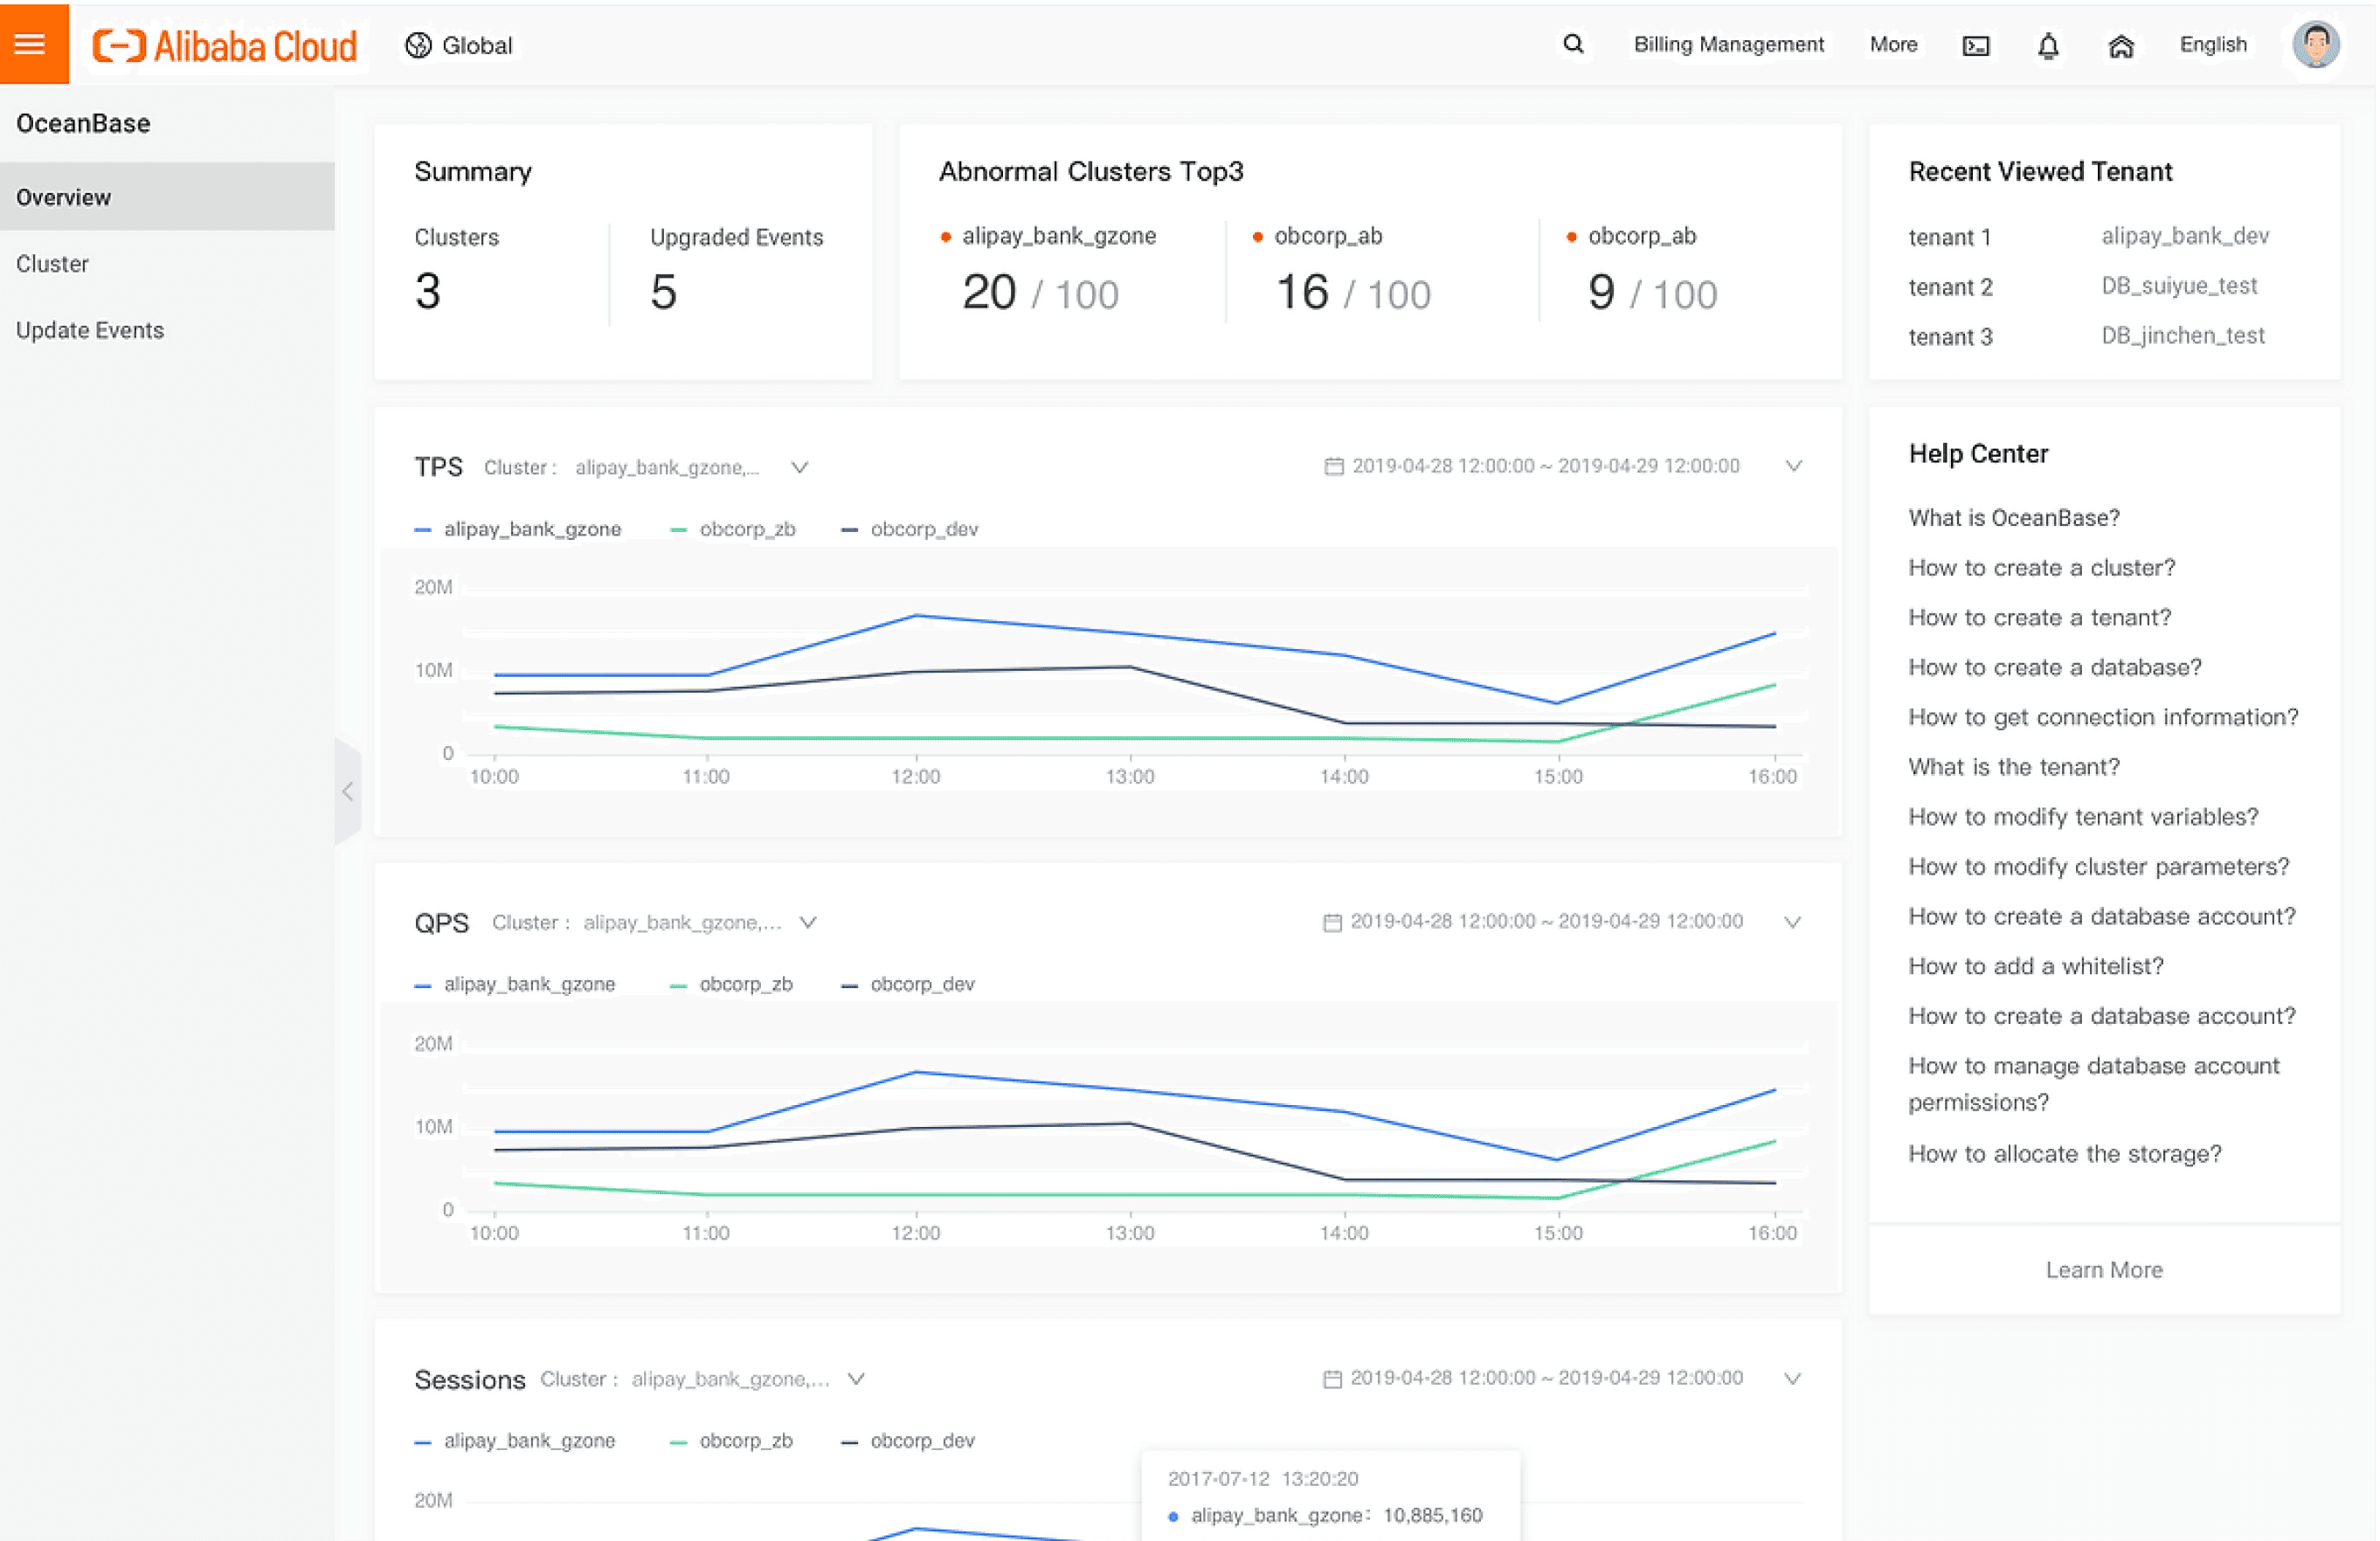
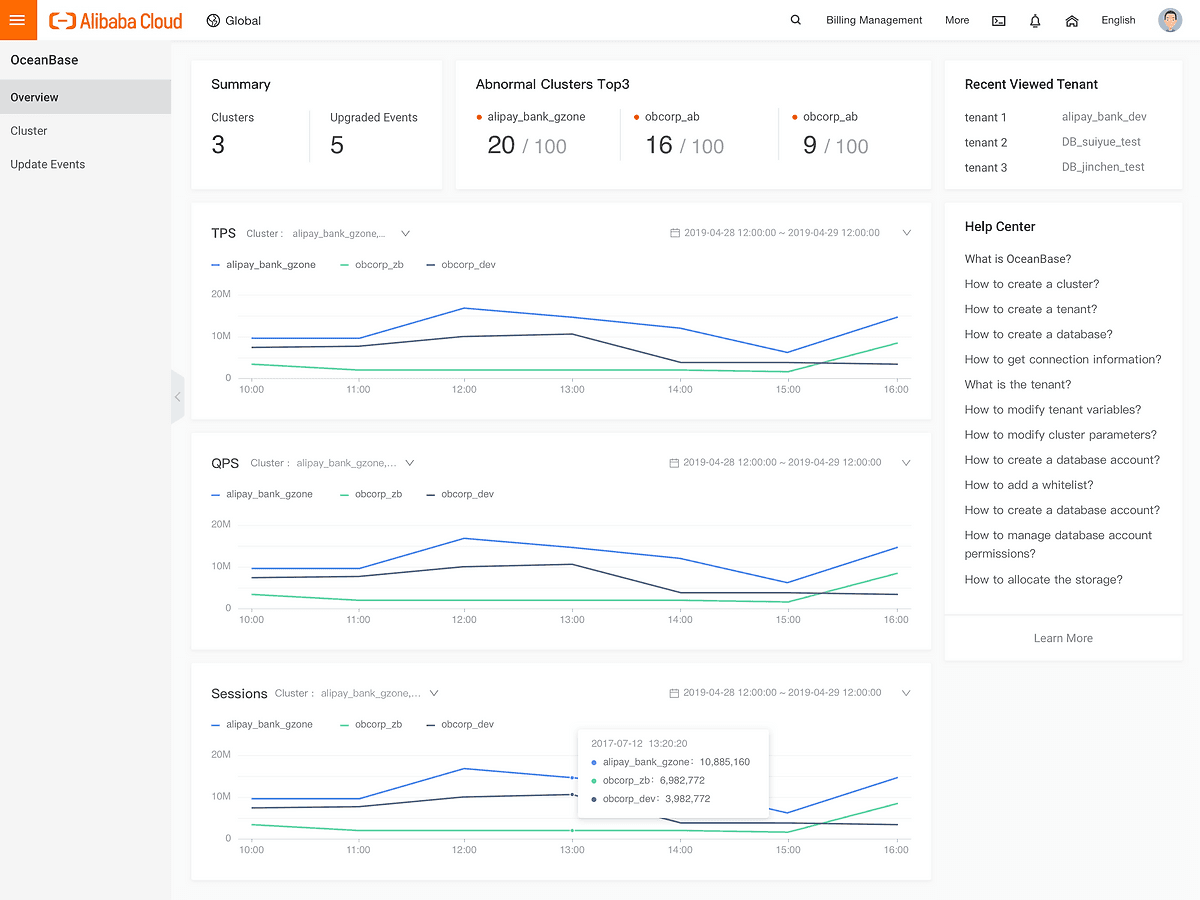
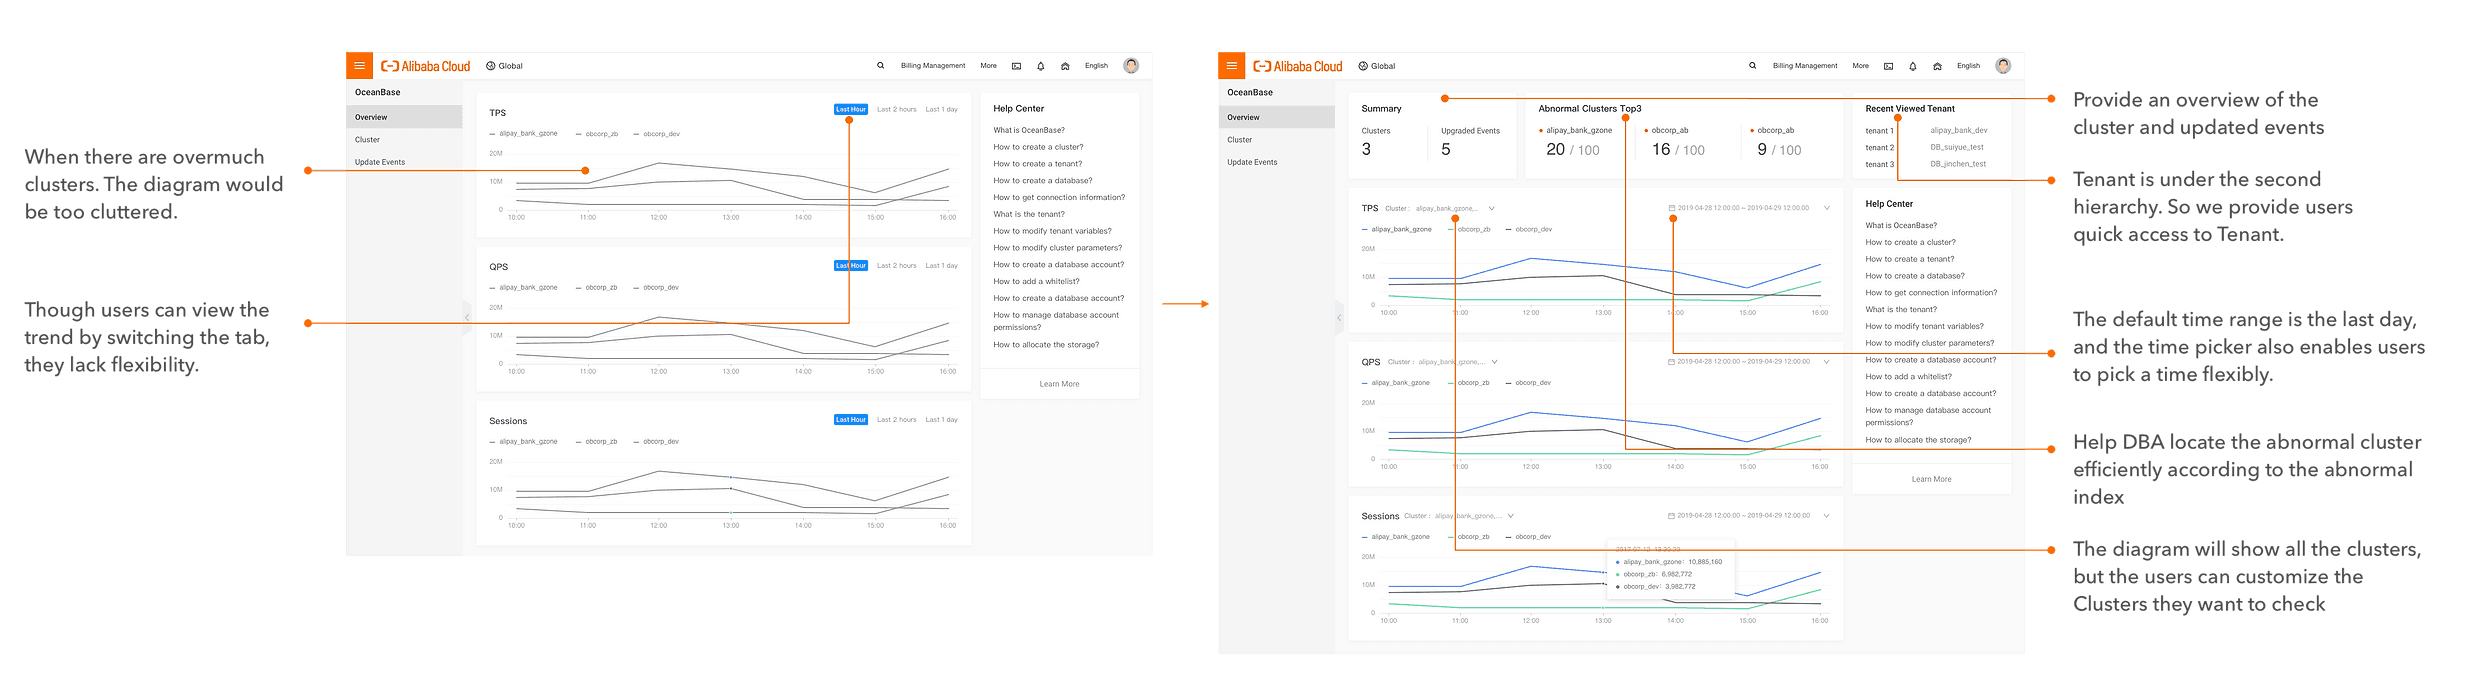
Dashboard: Quick Insights at a Glance
The dashboard empowers users to uncover performance issues in their clusters within minutes, offering valuable insights to detect deeper problems in their database tenants.
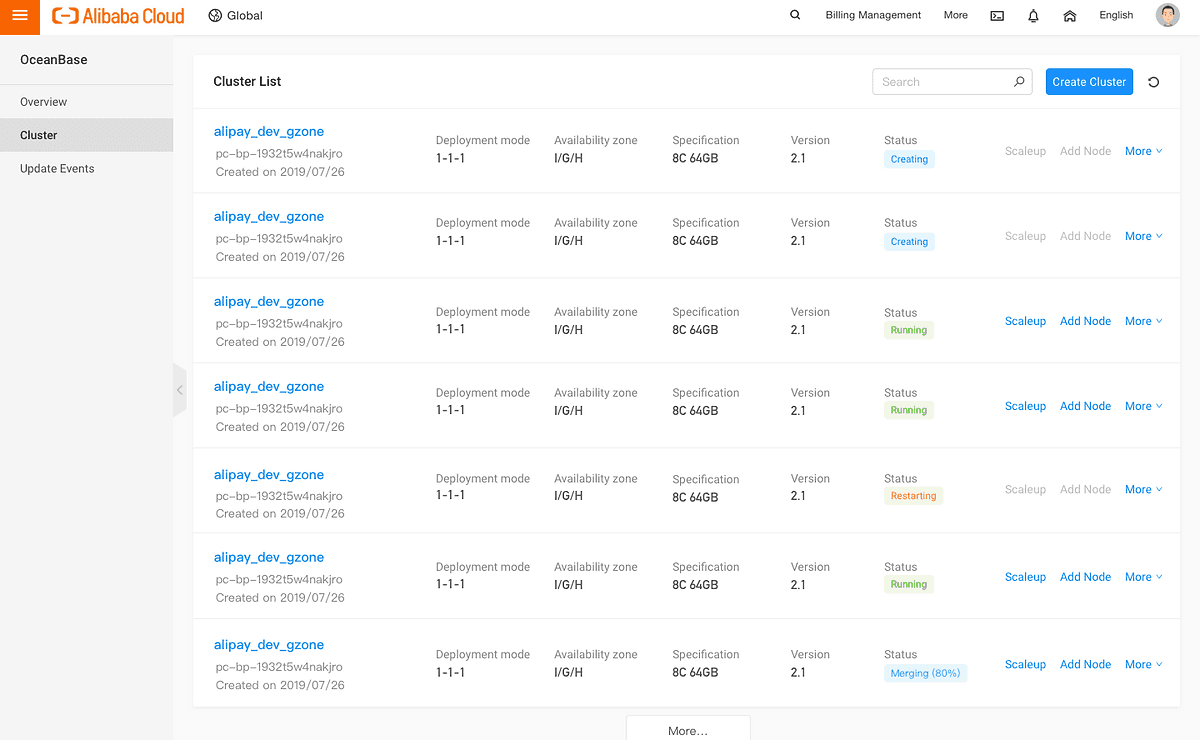
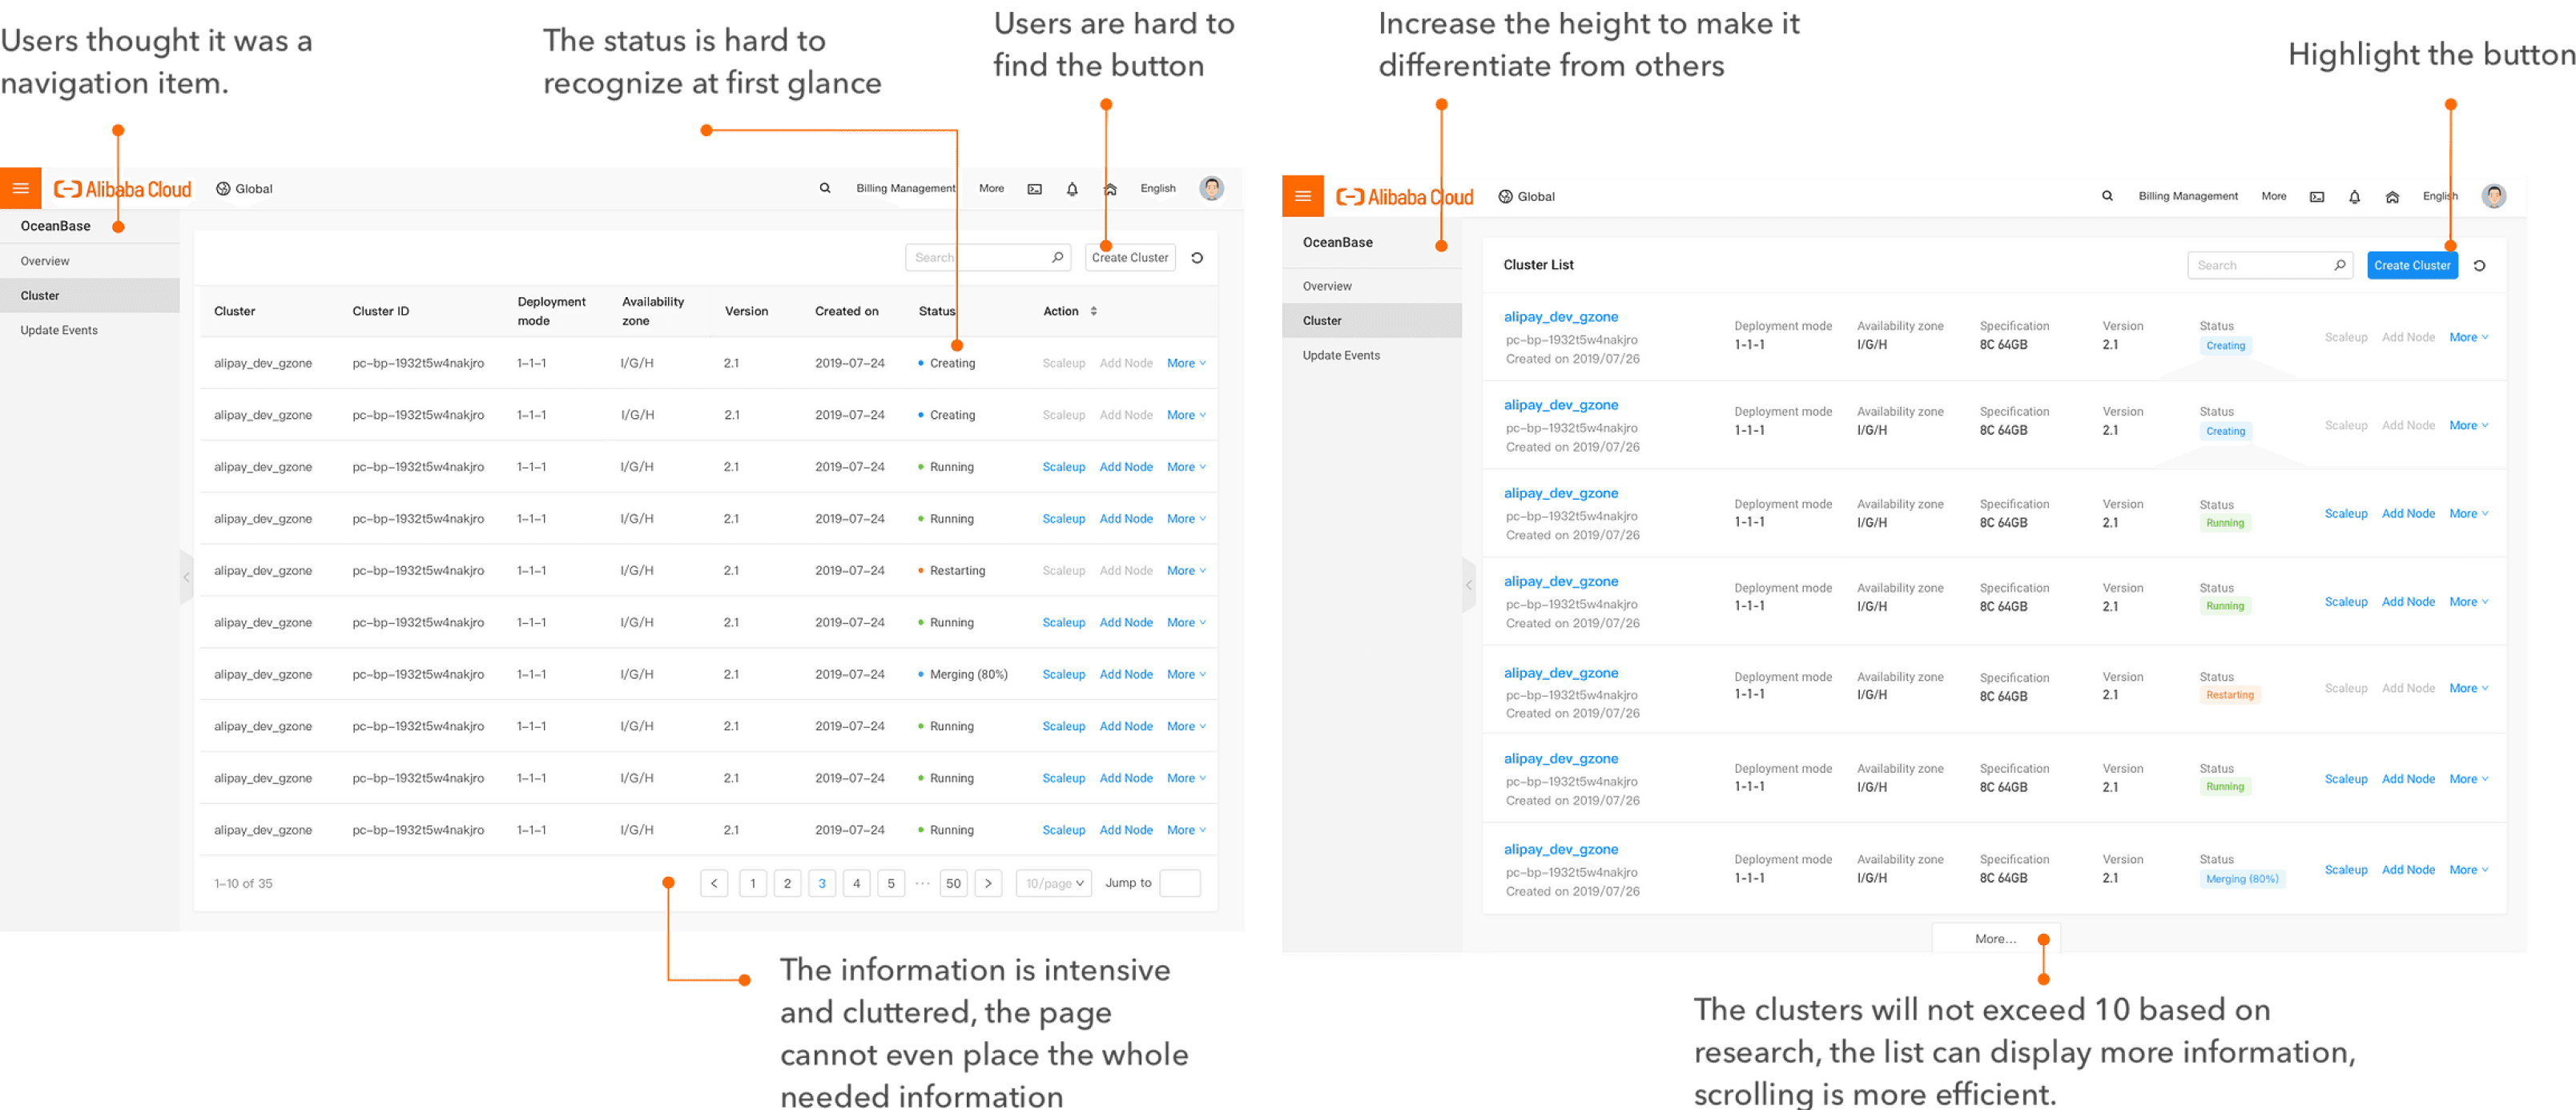
Cluster List: Simplified Monitoring and Action
Users can create and manage clusters effortlessly. The Cluster List provides a clean overview of cluster statuses and actions, helping users act quickly and efficiently.
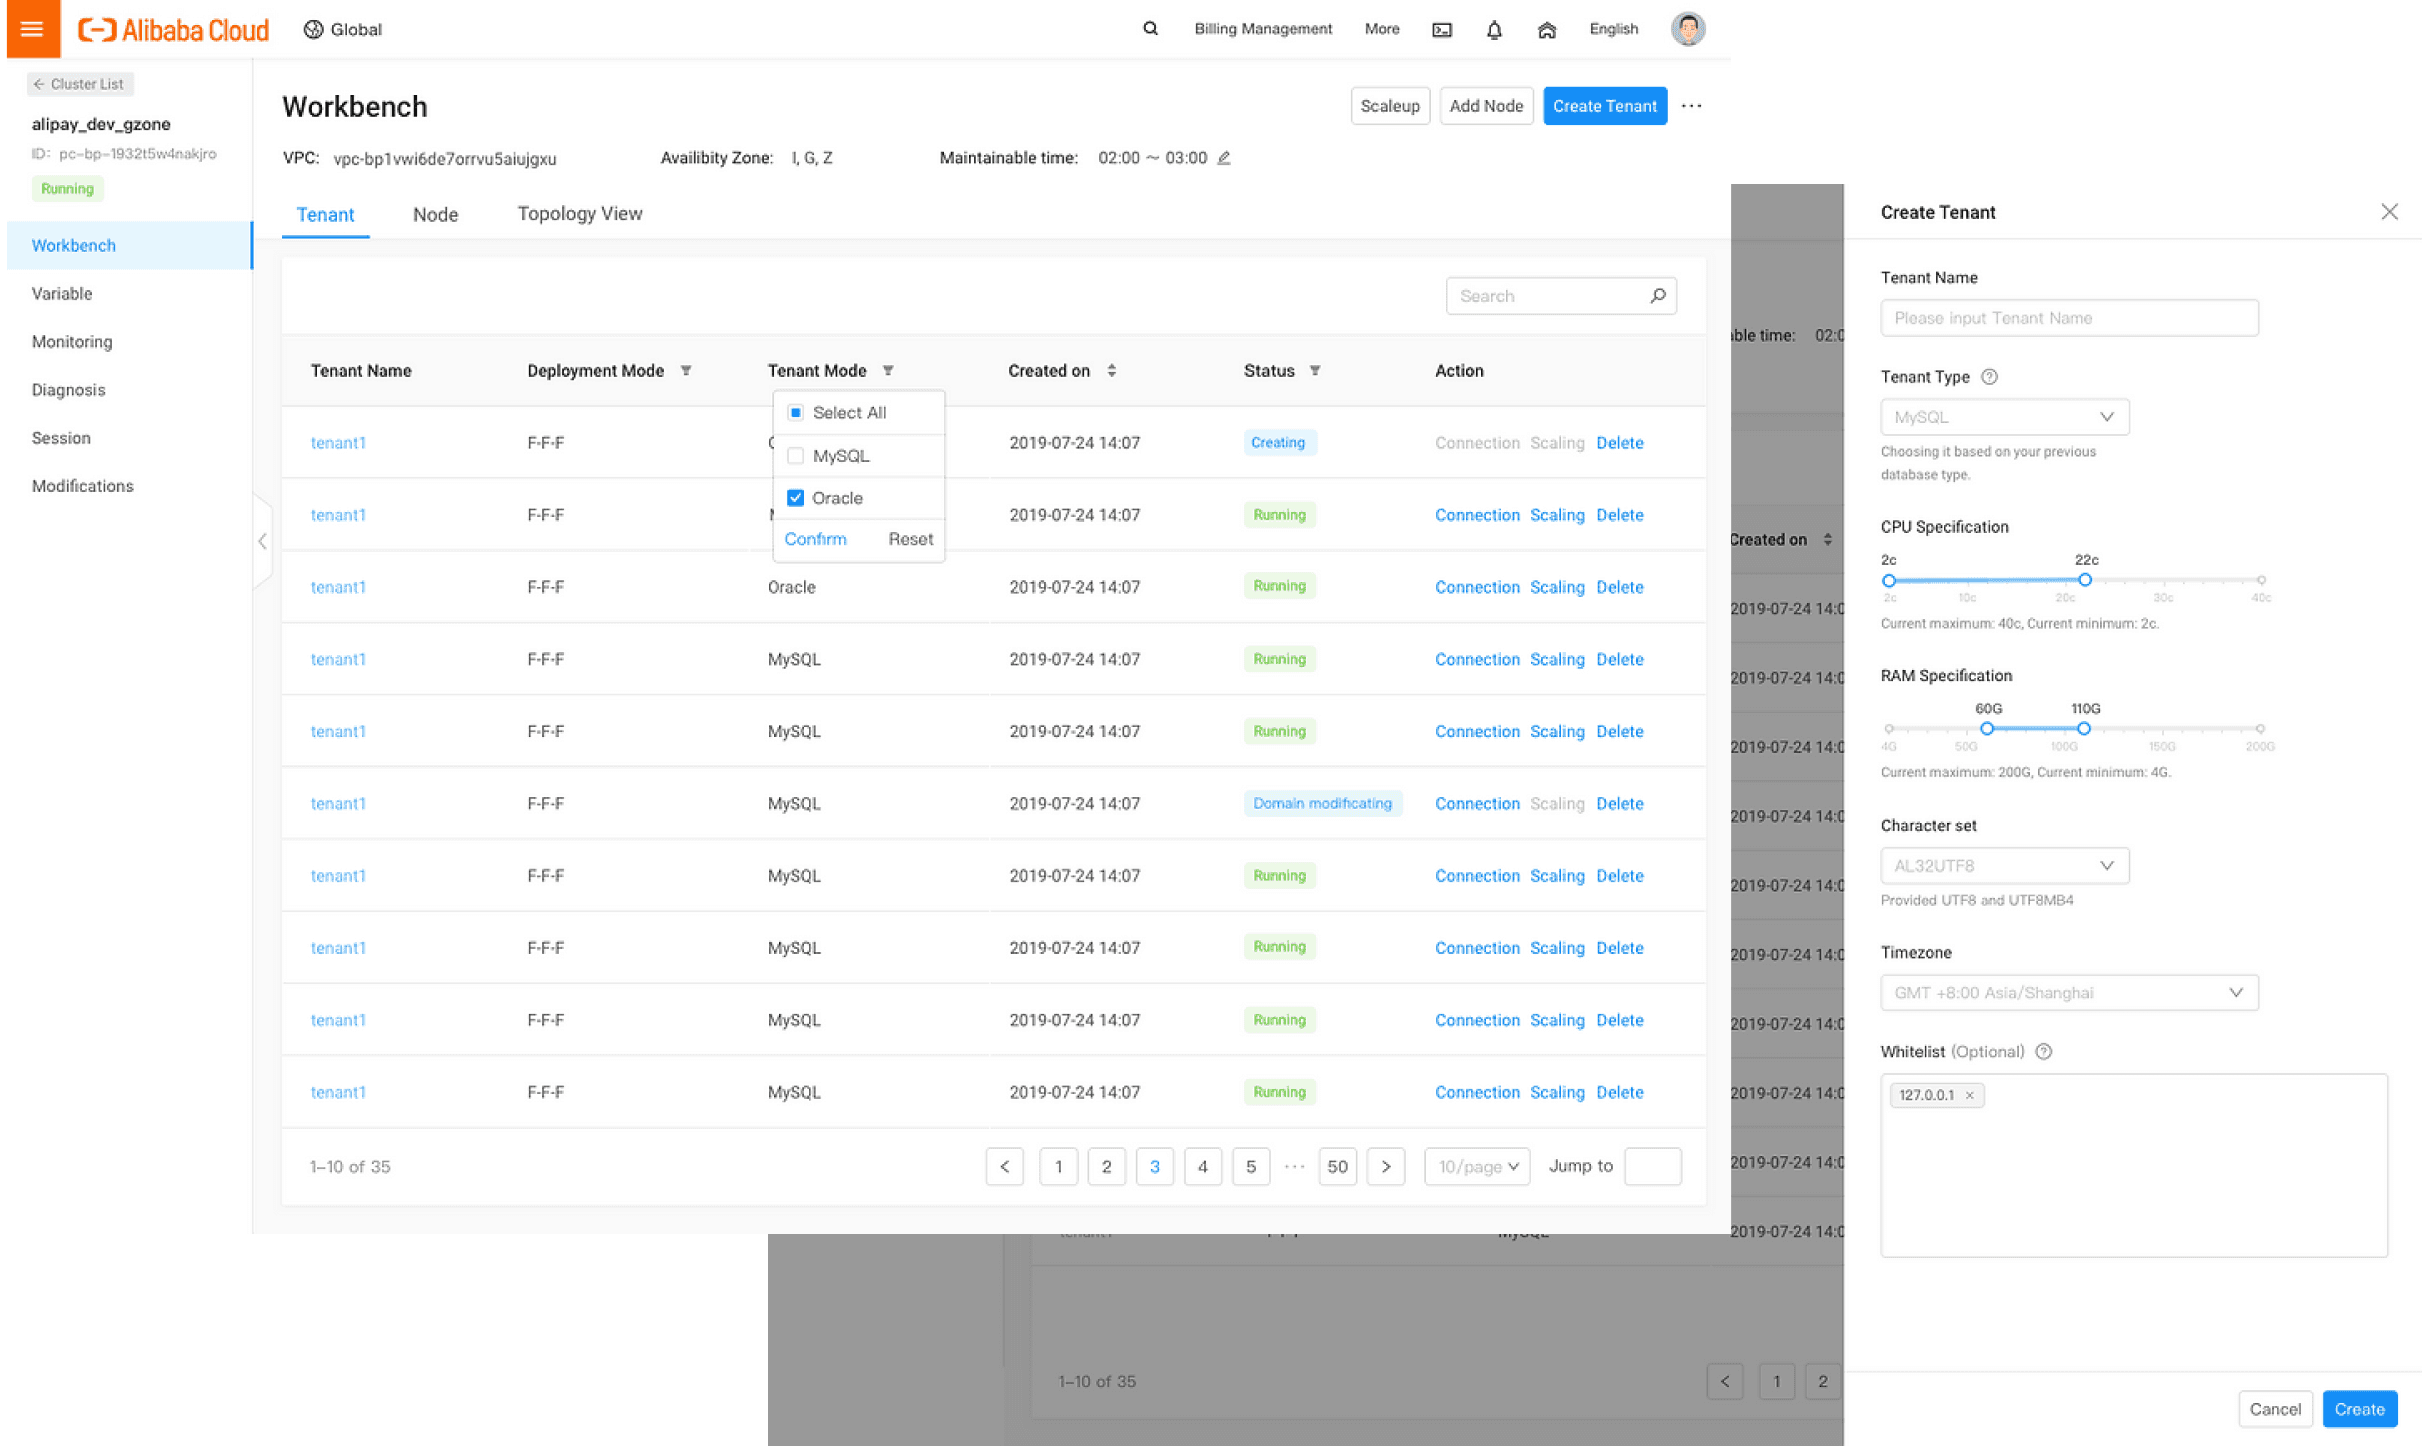
Cluster Workbench: Managing Tenants Made Simple
The Cluster Workbench centralizes tenant management, allowing users to create or manage tenants and nodes within clusters with just a few clicks.
Design process
Identifying User Needs and Business Requirements
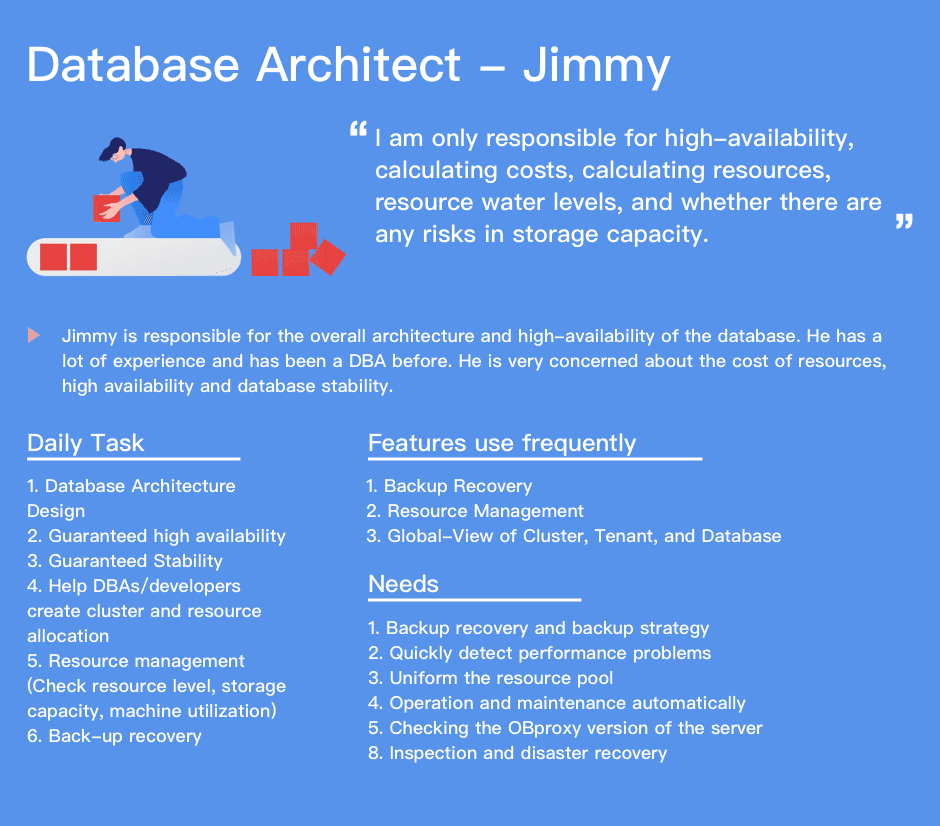
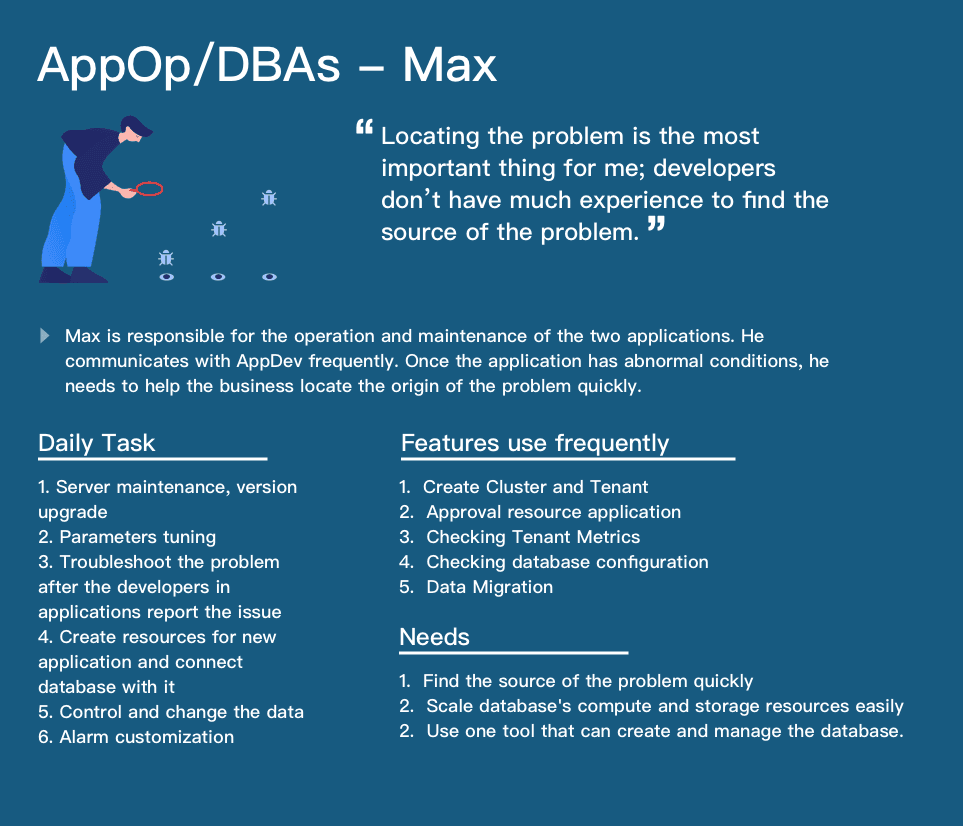
To design a solution that works for diverse users—ranging from enterprises with complex setups to small businesses with minimal resources—I conducted extensive user research.
The challenge was balancing technical requirements with usability. Large enterprises required robust tools to manage tens of clusters, while small businesses needed simple, accessible features. Our research identified user pain points, clarified constraints, and helped us prioritize features that would deliver value across the spectrum.

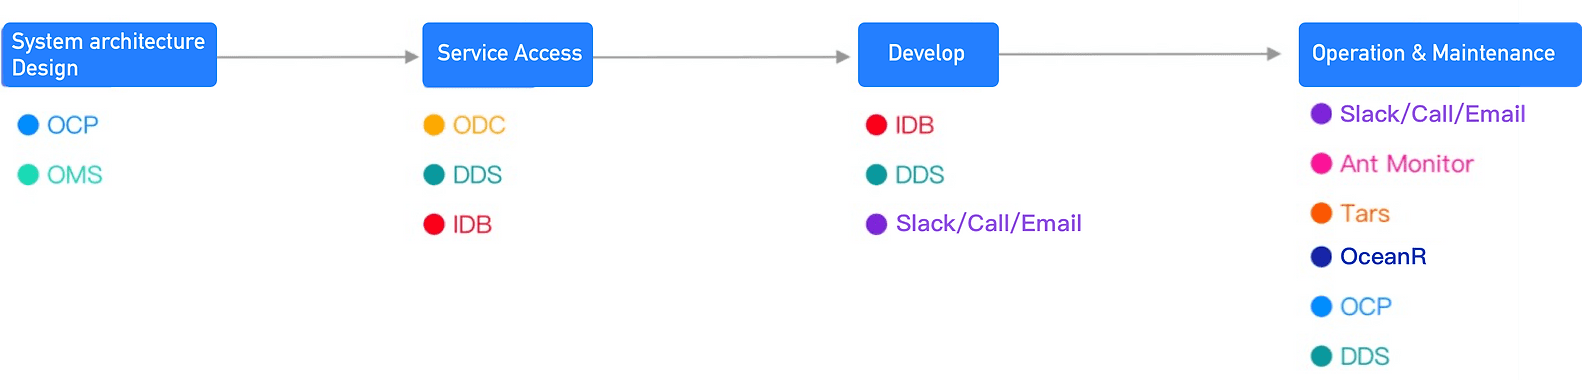
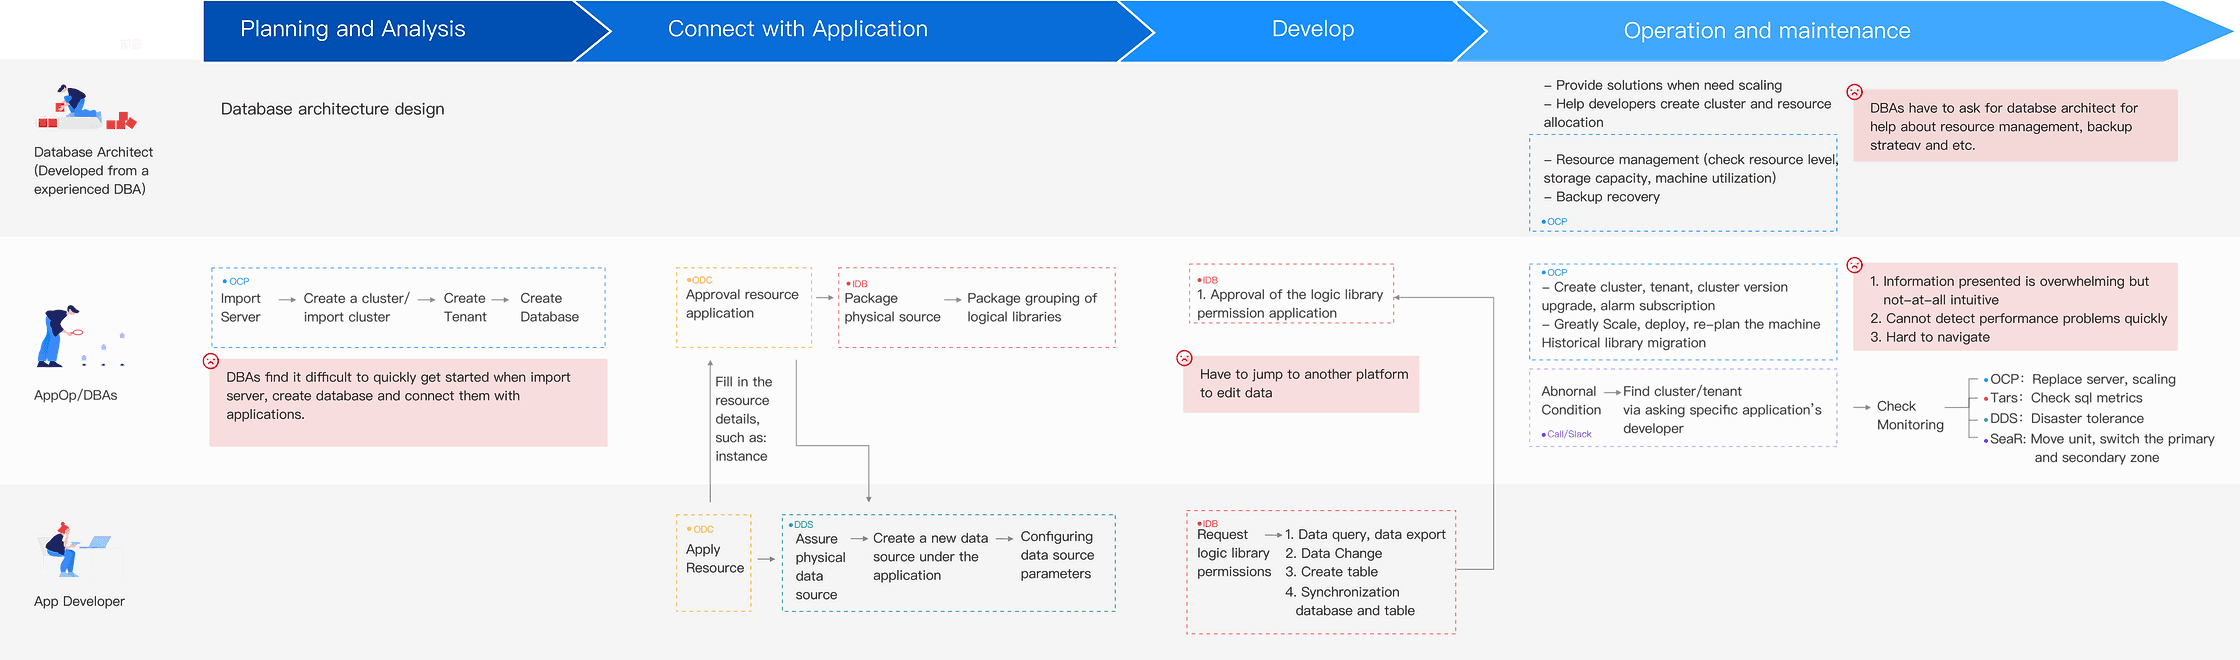
Making Complexity Manageable: Visualized User Flows
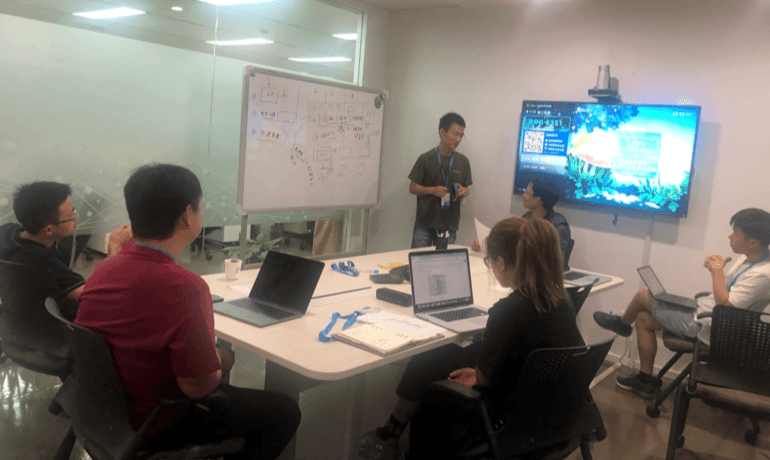
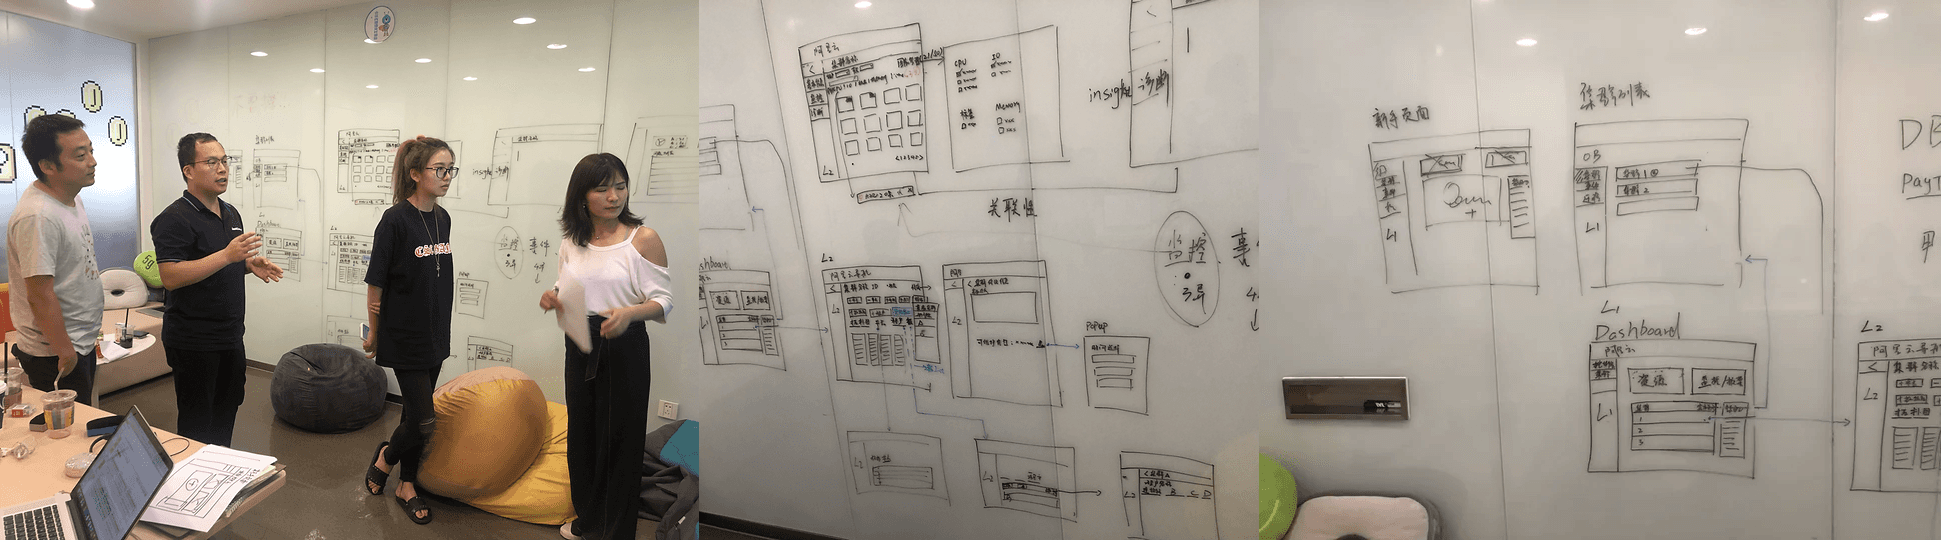
OceanBase’s complex workflows posed a challenge not only for users but also for the design and engineering teams. To tackle this, I created detailed user flows to break down processes into clear, actionable steps.
These visualizations helped align 20+ engineers, PMs, and stakeholders, offering clarity on the lifecycle of database management. By mapping workflows, we identified key moments in the user journey, established a shared vision, and uncovered pain points early in development.
Synthesis
Turn Research Insights to Designs
By addressing these user needs and pain points, we were able to design a platform that:
Reduces friction in workflows and eliminates inefficiencies.
Empowers users with actionable insights and automation, improving productivity.
Adapts to the diverse requirements of both large enterprises and small businesses.
Bridges the gap between technical complexity and usability, ensuring the product is both scalable and intuitive.
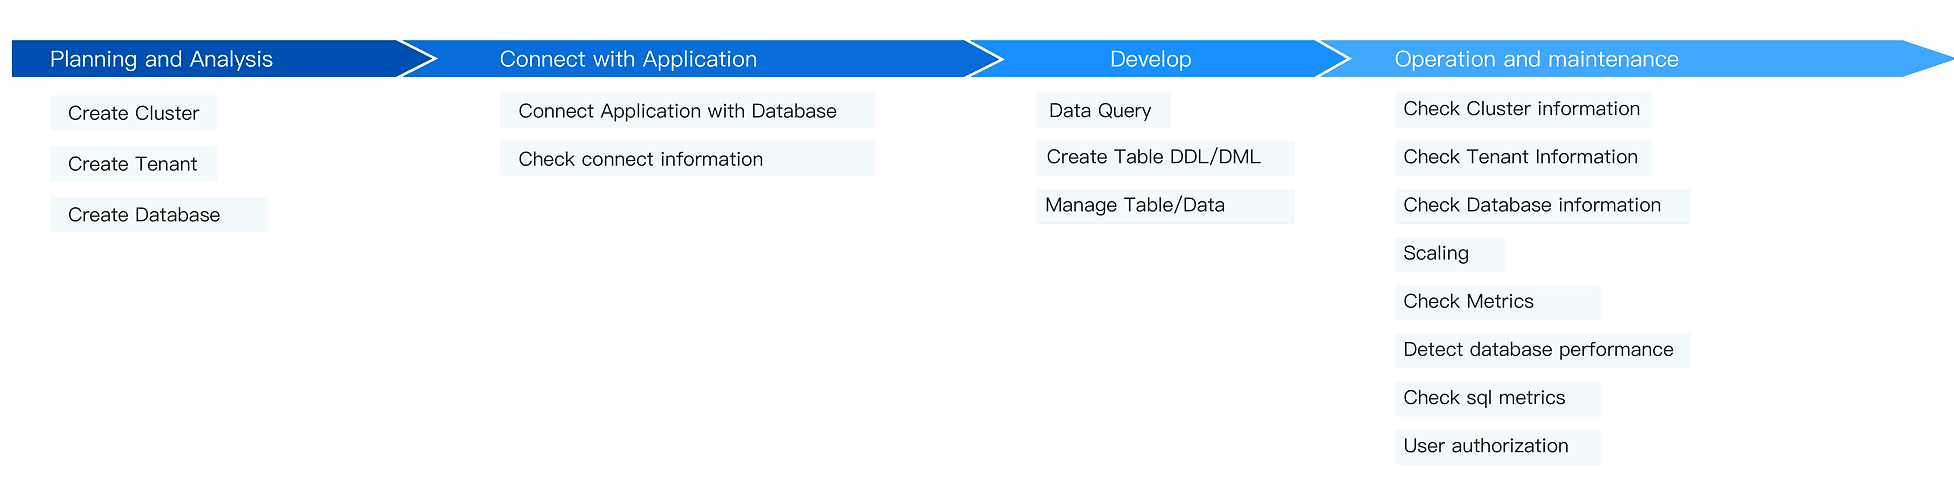
Streamlined Setup and Management
Simplify the end-to-end process for creating clusters, tenants, and databases in one unified platform.
Provide a “Quick Start” setup wizard for new users.
Enhanced Monitoring and Insights
Develop a centralized dashboard displaying resource utilization, SQL performance, and cluster health.
Introduce real-time alerts with actionable recommendations.
Self-Service Tools and Automation:
Automate repetitive maintenance tasks, such as backup recovery and scaling.
Enable DBAs to independently manage resources without constant reliance on architects.
User-Centric Workflows
Align workflows with user mental models by introducing hierarchical visualizations and progressive disclosure.
Create role-specific views to simplify interfaces for different user groups.
Design Iteration
Iterating to Perfection: Low-Fidelity Prototyping and Validation
We began with wireframes to outline the information architecture and layout, focusing on gathering feedback from users, PMs, and engineers.
Through multiple rounds of testing, we refined our designs. For instance, initial prototypes grouped features like Monitoring, Suggestions, and SQL under “Diagnosis,” assuming users would prioritize problem-solving. However, testing revealed that Monitoring was a daily routine, prompting us to elevate it for easier access.
This iterative process allowed us to fine-tune the design based on real user workflows and preferences.
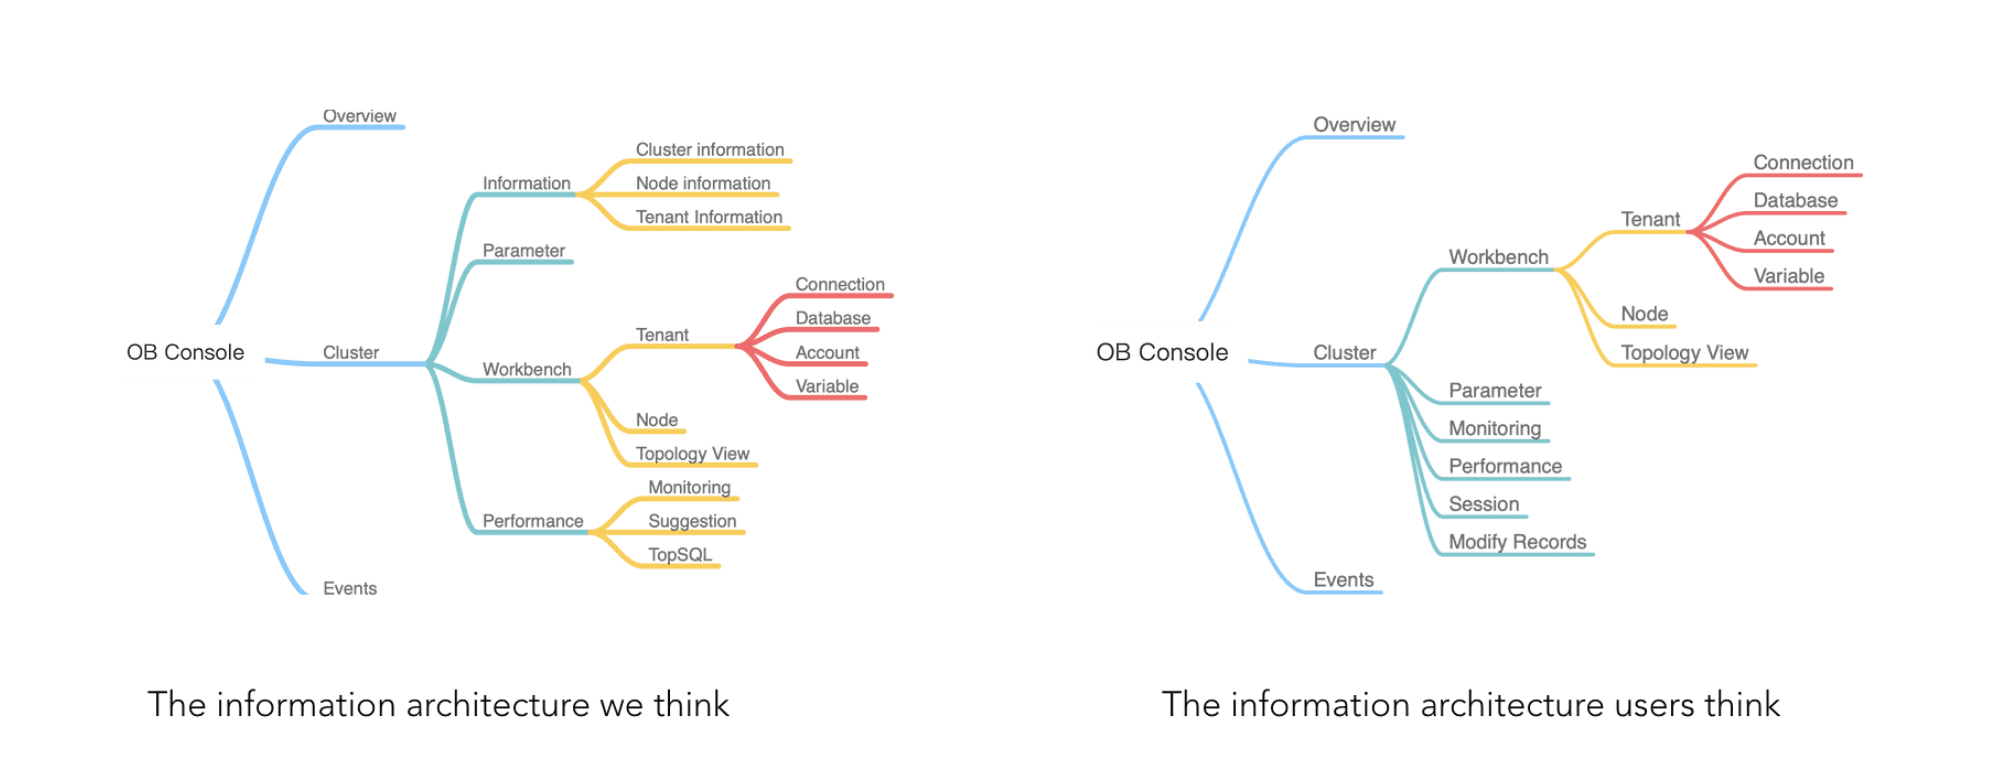
Information Architecture Iteration
At first, we designed information architecture based on our understanding, but after user testing, we asked how users think of the information architecture and then modify it. For example, we put Monitoring, Suggestion and SQL under the Diagnosis at first, because we thought users would click Diagnosis first to find any problems in their database and then check the monitoring. However, users claimed that checking monitoring was a daily routine while checking diagnosis was not. So we moved Monitoring to a higher layer.
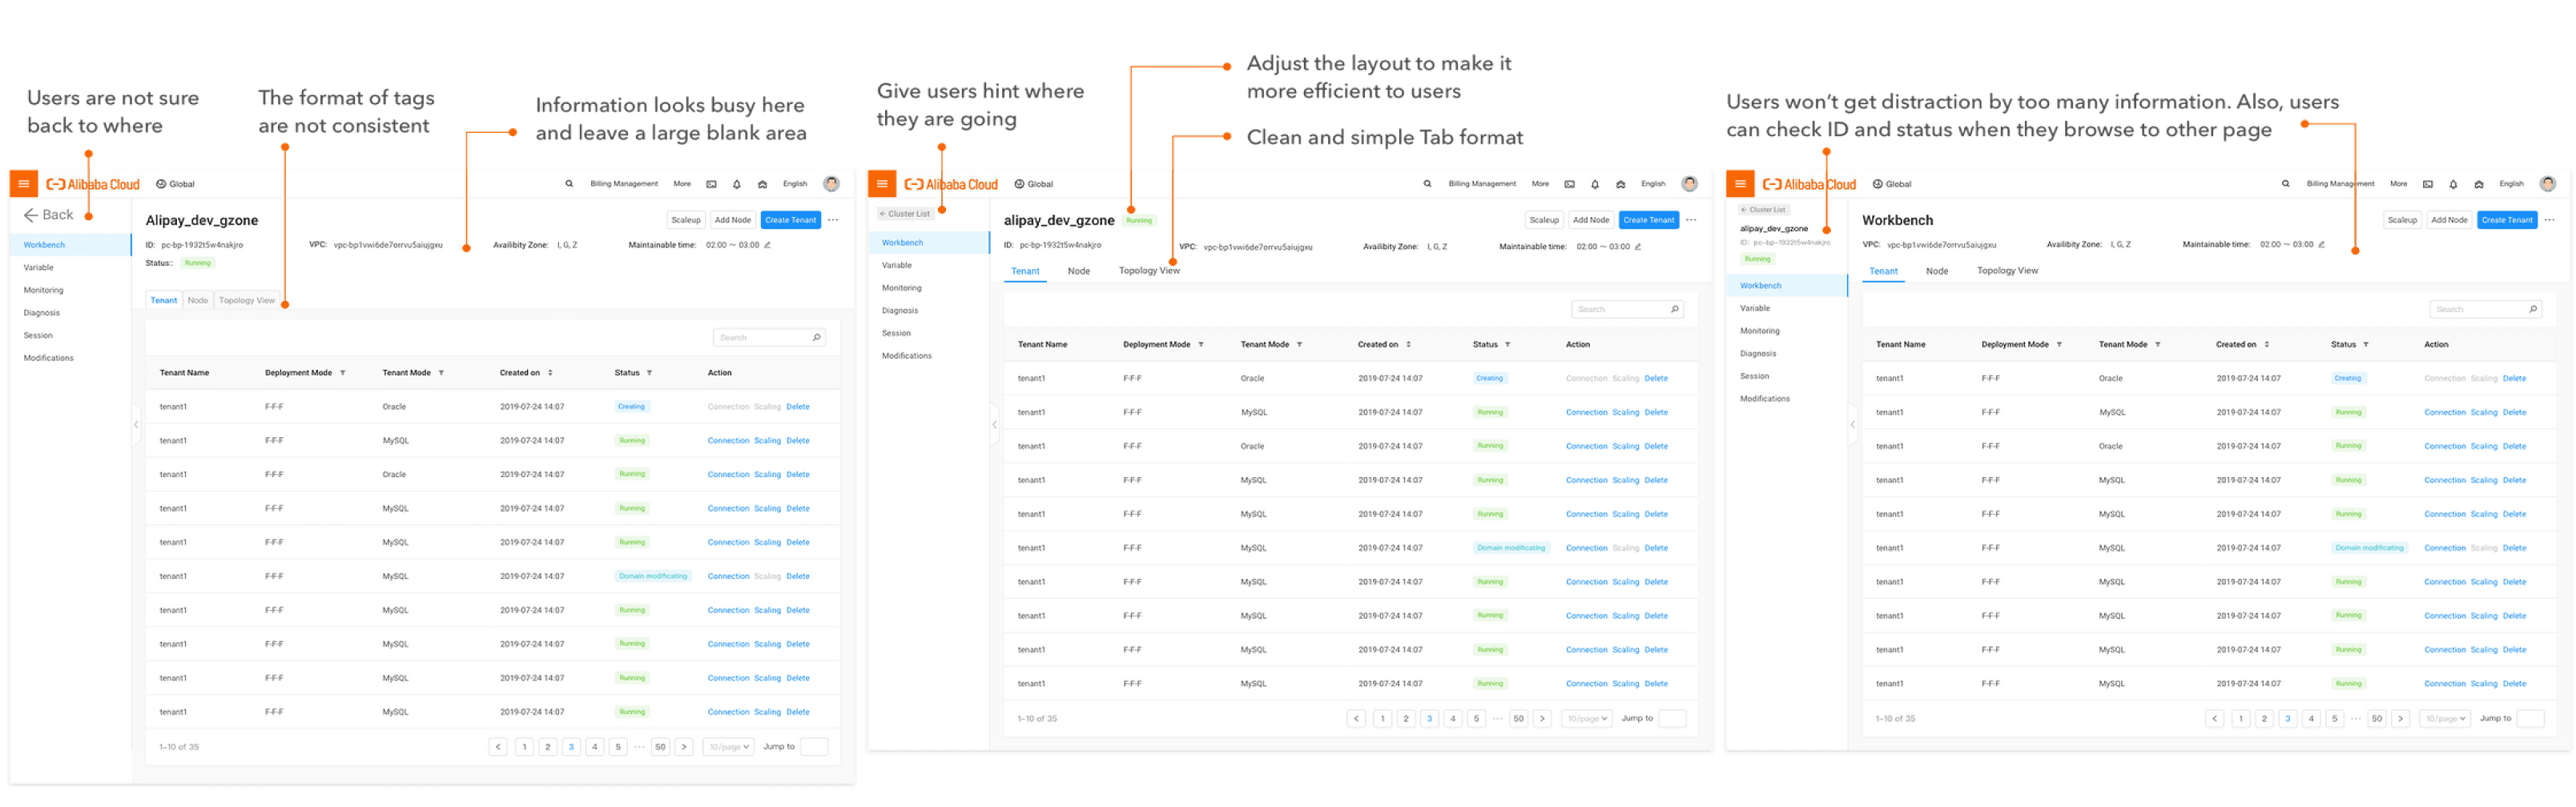
Design Iteration Highlights
I developed high-fidelity mockups consistent with Alibaba Cloud’s design language. I collaborated closely with front-end developers, ensuring that all interactions and components were implemented accurately.
To maintain quality, I conducted thorough UX reviews for each feature, aligning the final implementation with the intended design before launch.
Dashboard for returning users
Cluster List
Navigation Paradigm
Takeaways
Strategic MVP Planning
Defining a clear scope and focusing on core user needs prevented scope creep, enabling us to deliver a high-quality product within the timeline.
Cross-Team Collaboration
Involving engineers early in the process ensured that design decisions aligned with technical constraints. Regular communication across teams helped us reduce rework and maintain a user-first approach throughout the project.
Thanks for Stopping By
Evie Xu